Show Some Flash and Dew the Dew with a Little Bubbly!
DOFPro Team

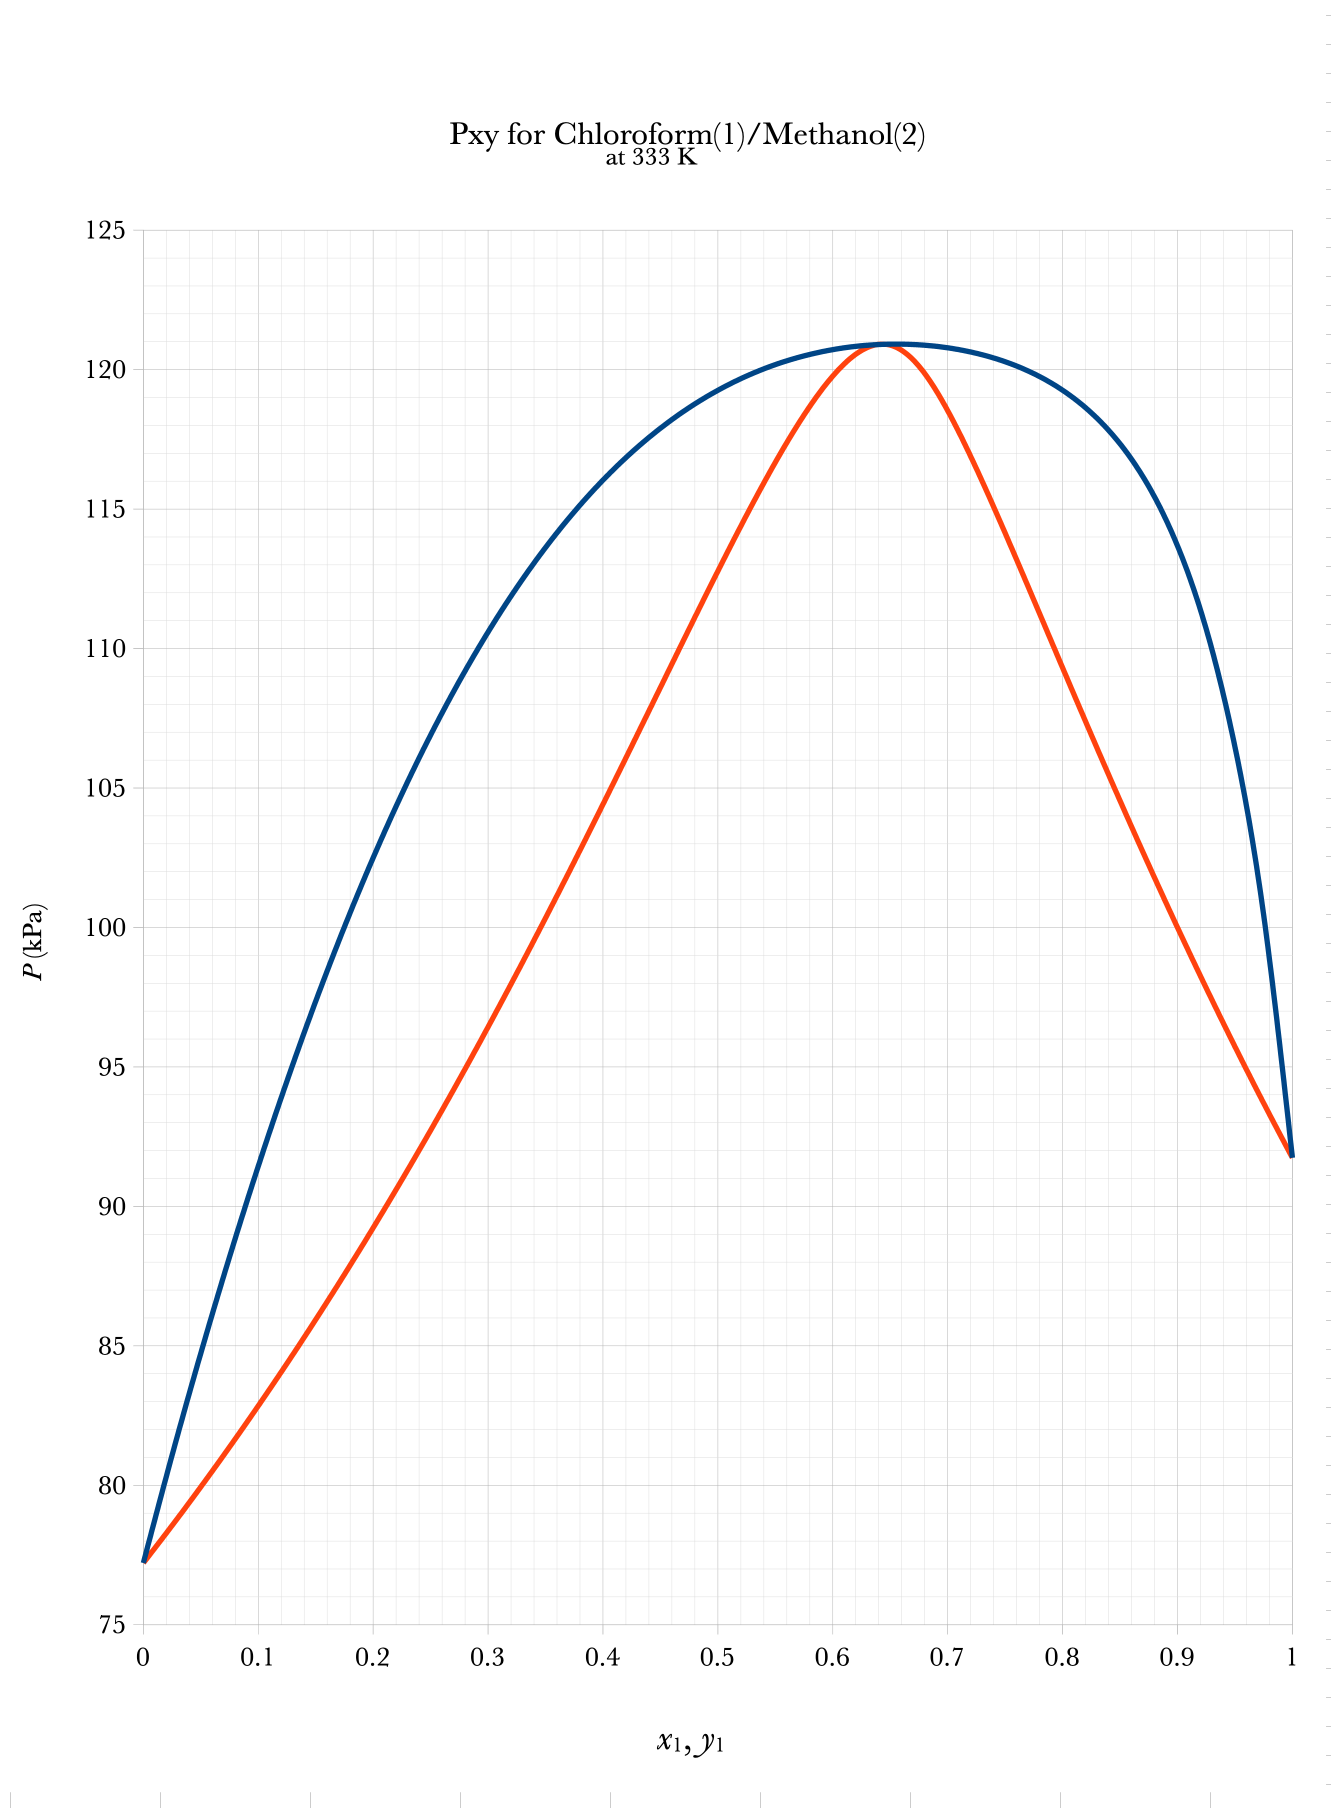
Txy and Pxy Binary Phase Diagrams
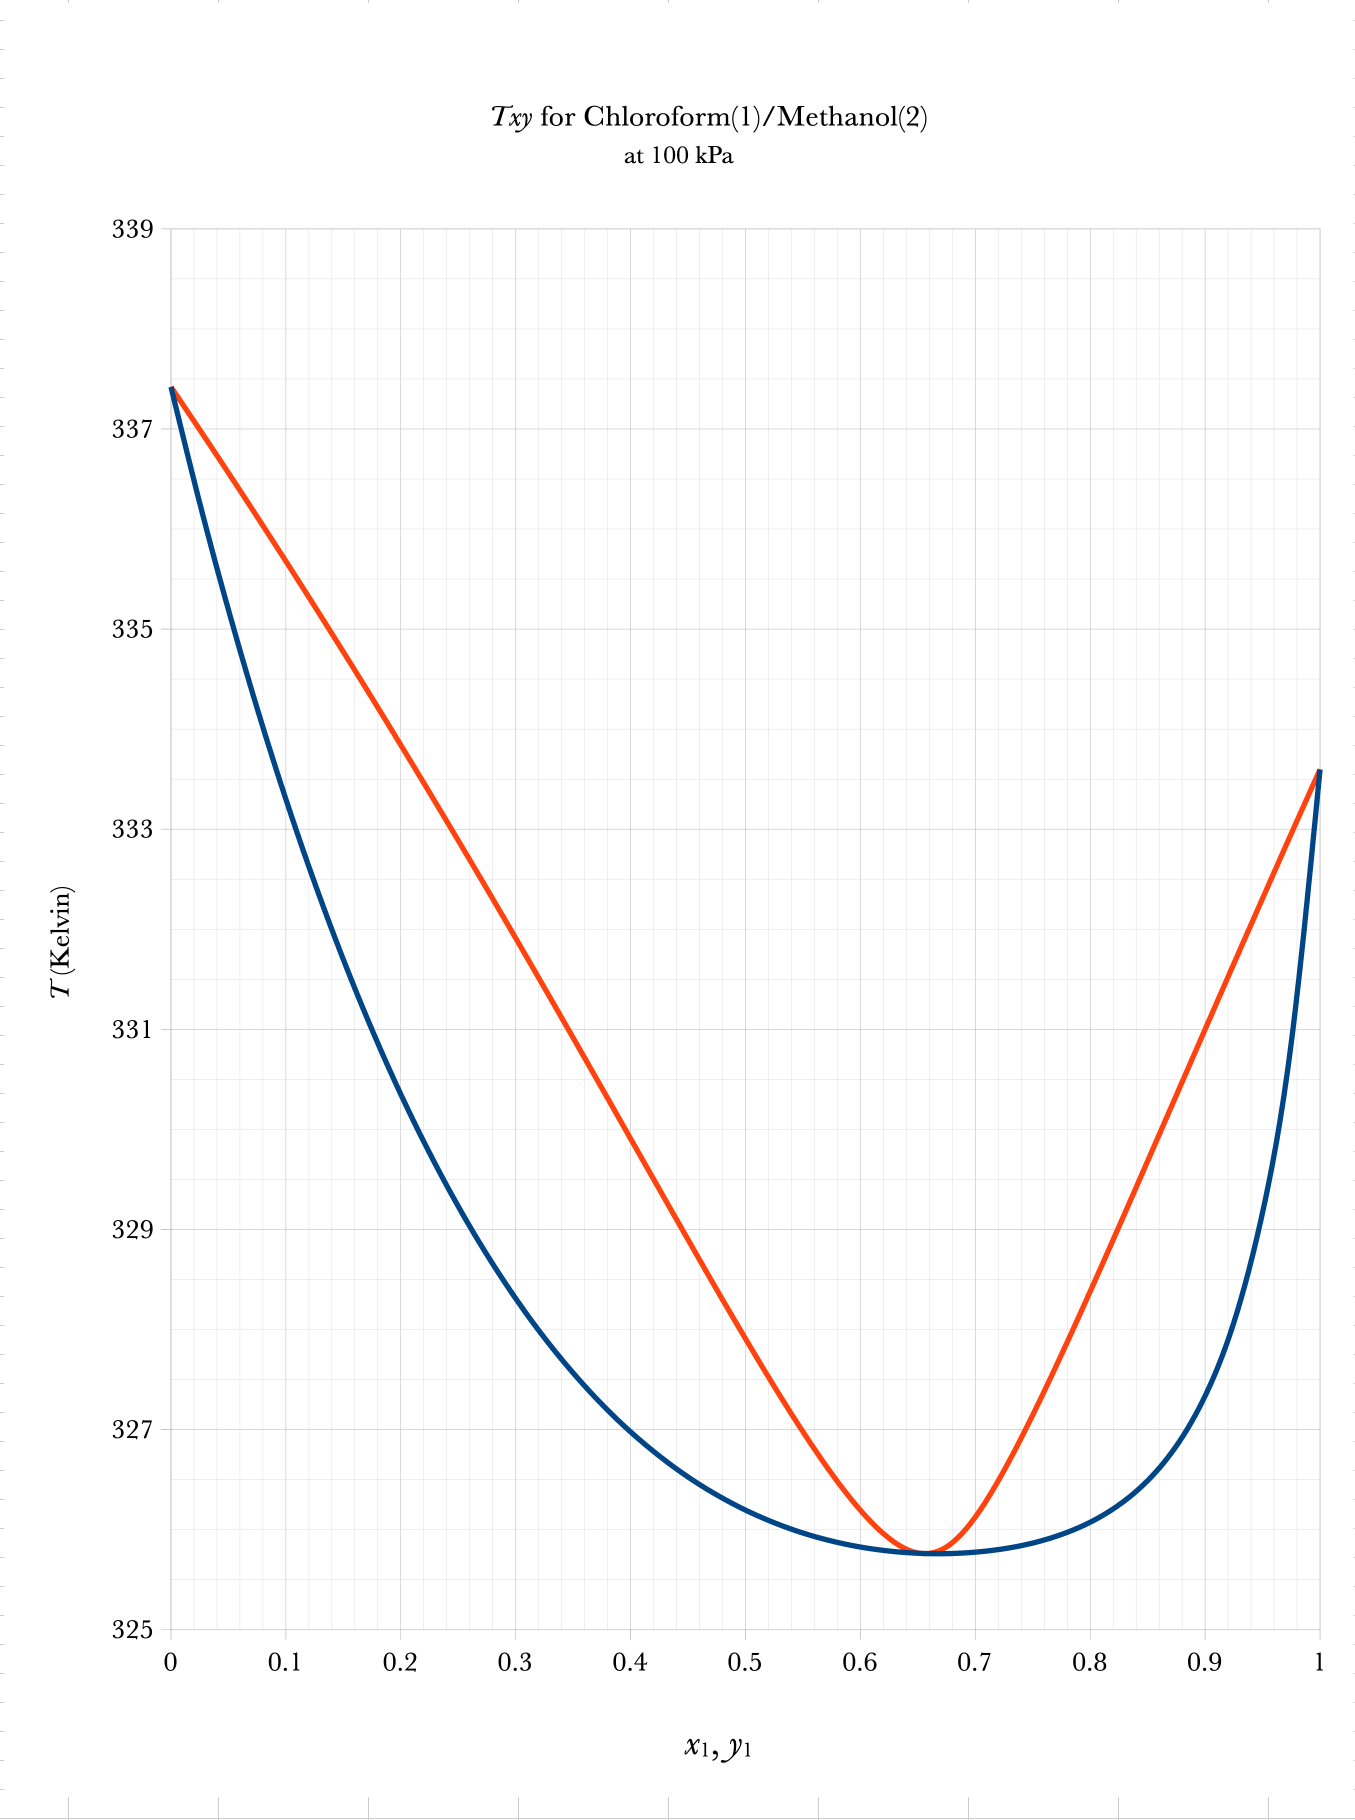
\(\mathrm{vapor}\)
\(2\text{–}\phi\)
\(\mathrm{liquid}\)
\(\mathrm{vapor}\)
\(2\text{–}\phi\)
\(\mathrm{liquid}\)
The Lever Rule for Phase Diagrams
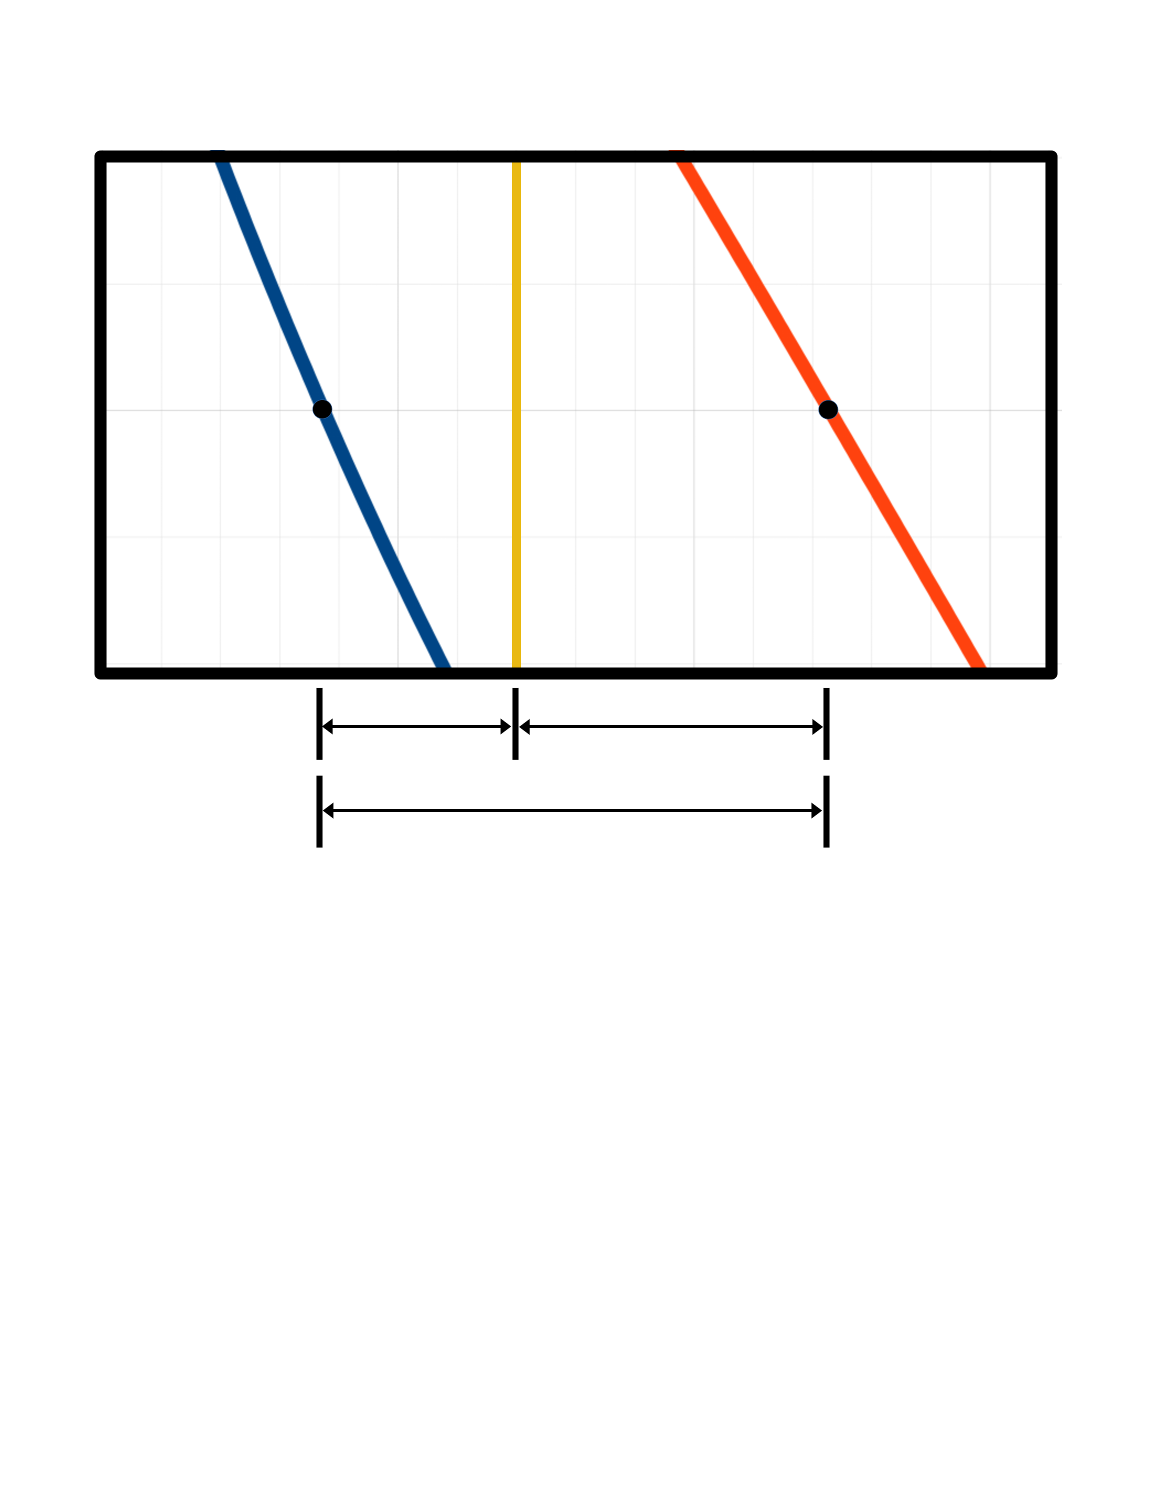
\(\text{Phase }\alpha\)
\(\text{Phase }\beta\)
\(2\text{–}\phi\)
\(x_\mathrm{O}\)
\(x_\alpha\)
\(x_\beta\)
\(l_1 = x_\mathrm{O} - x_\alpha\)
\(l_2 = x_\beta - x_\mathrm{O}\)
\(l_3 = x_\beta - x_\alpha\)
If
\(\ \ \ \ n_\mathrm{total} = n_\alpha + n_\beta\)
Then
\(\ \ \ \ n_\alpha l_1 = n_\beta l_2\)
\(\ \ \ \ \dfrac{n_\alpha}{n_\mathrm{total}} = \dfrac{l_2}{l_3}\)
\(\ \ \ \ \dfrac{n_\beta}{n_\mathrm{total}} = \dfrac{l_1}{l_3}\)
If \(\alpha\) is a liquid and \(\beta\) is a vapor, then
\(\mathcal{V} \equiv \dfrac{n_\beta}{n_\mathrm{total}} = \dfrac{l_1}{l_3}\) and \(\mathcal{L} \equiv \dfrac{n_\alpha}{n_\mathrm{total}} = \dfrac{l_2}{l_3}\)
Graphical BUBL P, DEW P
Overall
Composition
Subcooled
Liquid
Superheated
Vapor
\(2\text{–}\phi\)
Bubble
Pressure
Bubble
Composition
Dew
Pressure
Dew
Composition
Low Boiling
Azeotrope
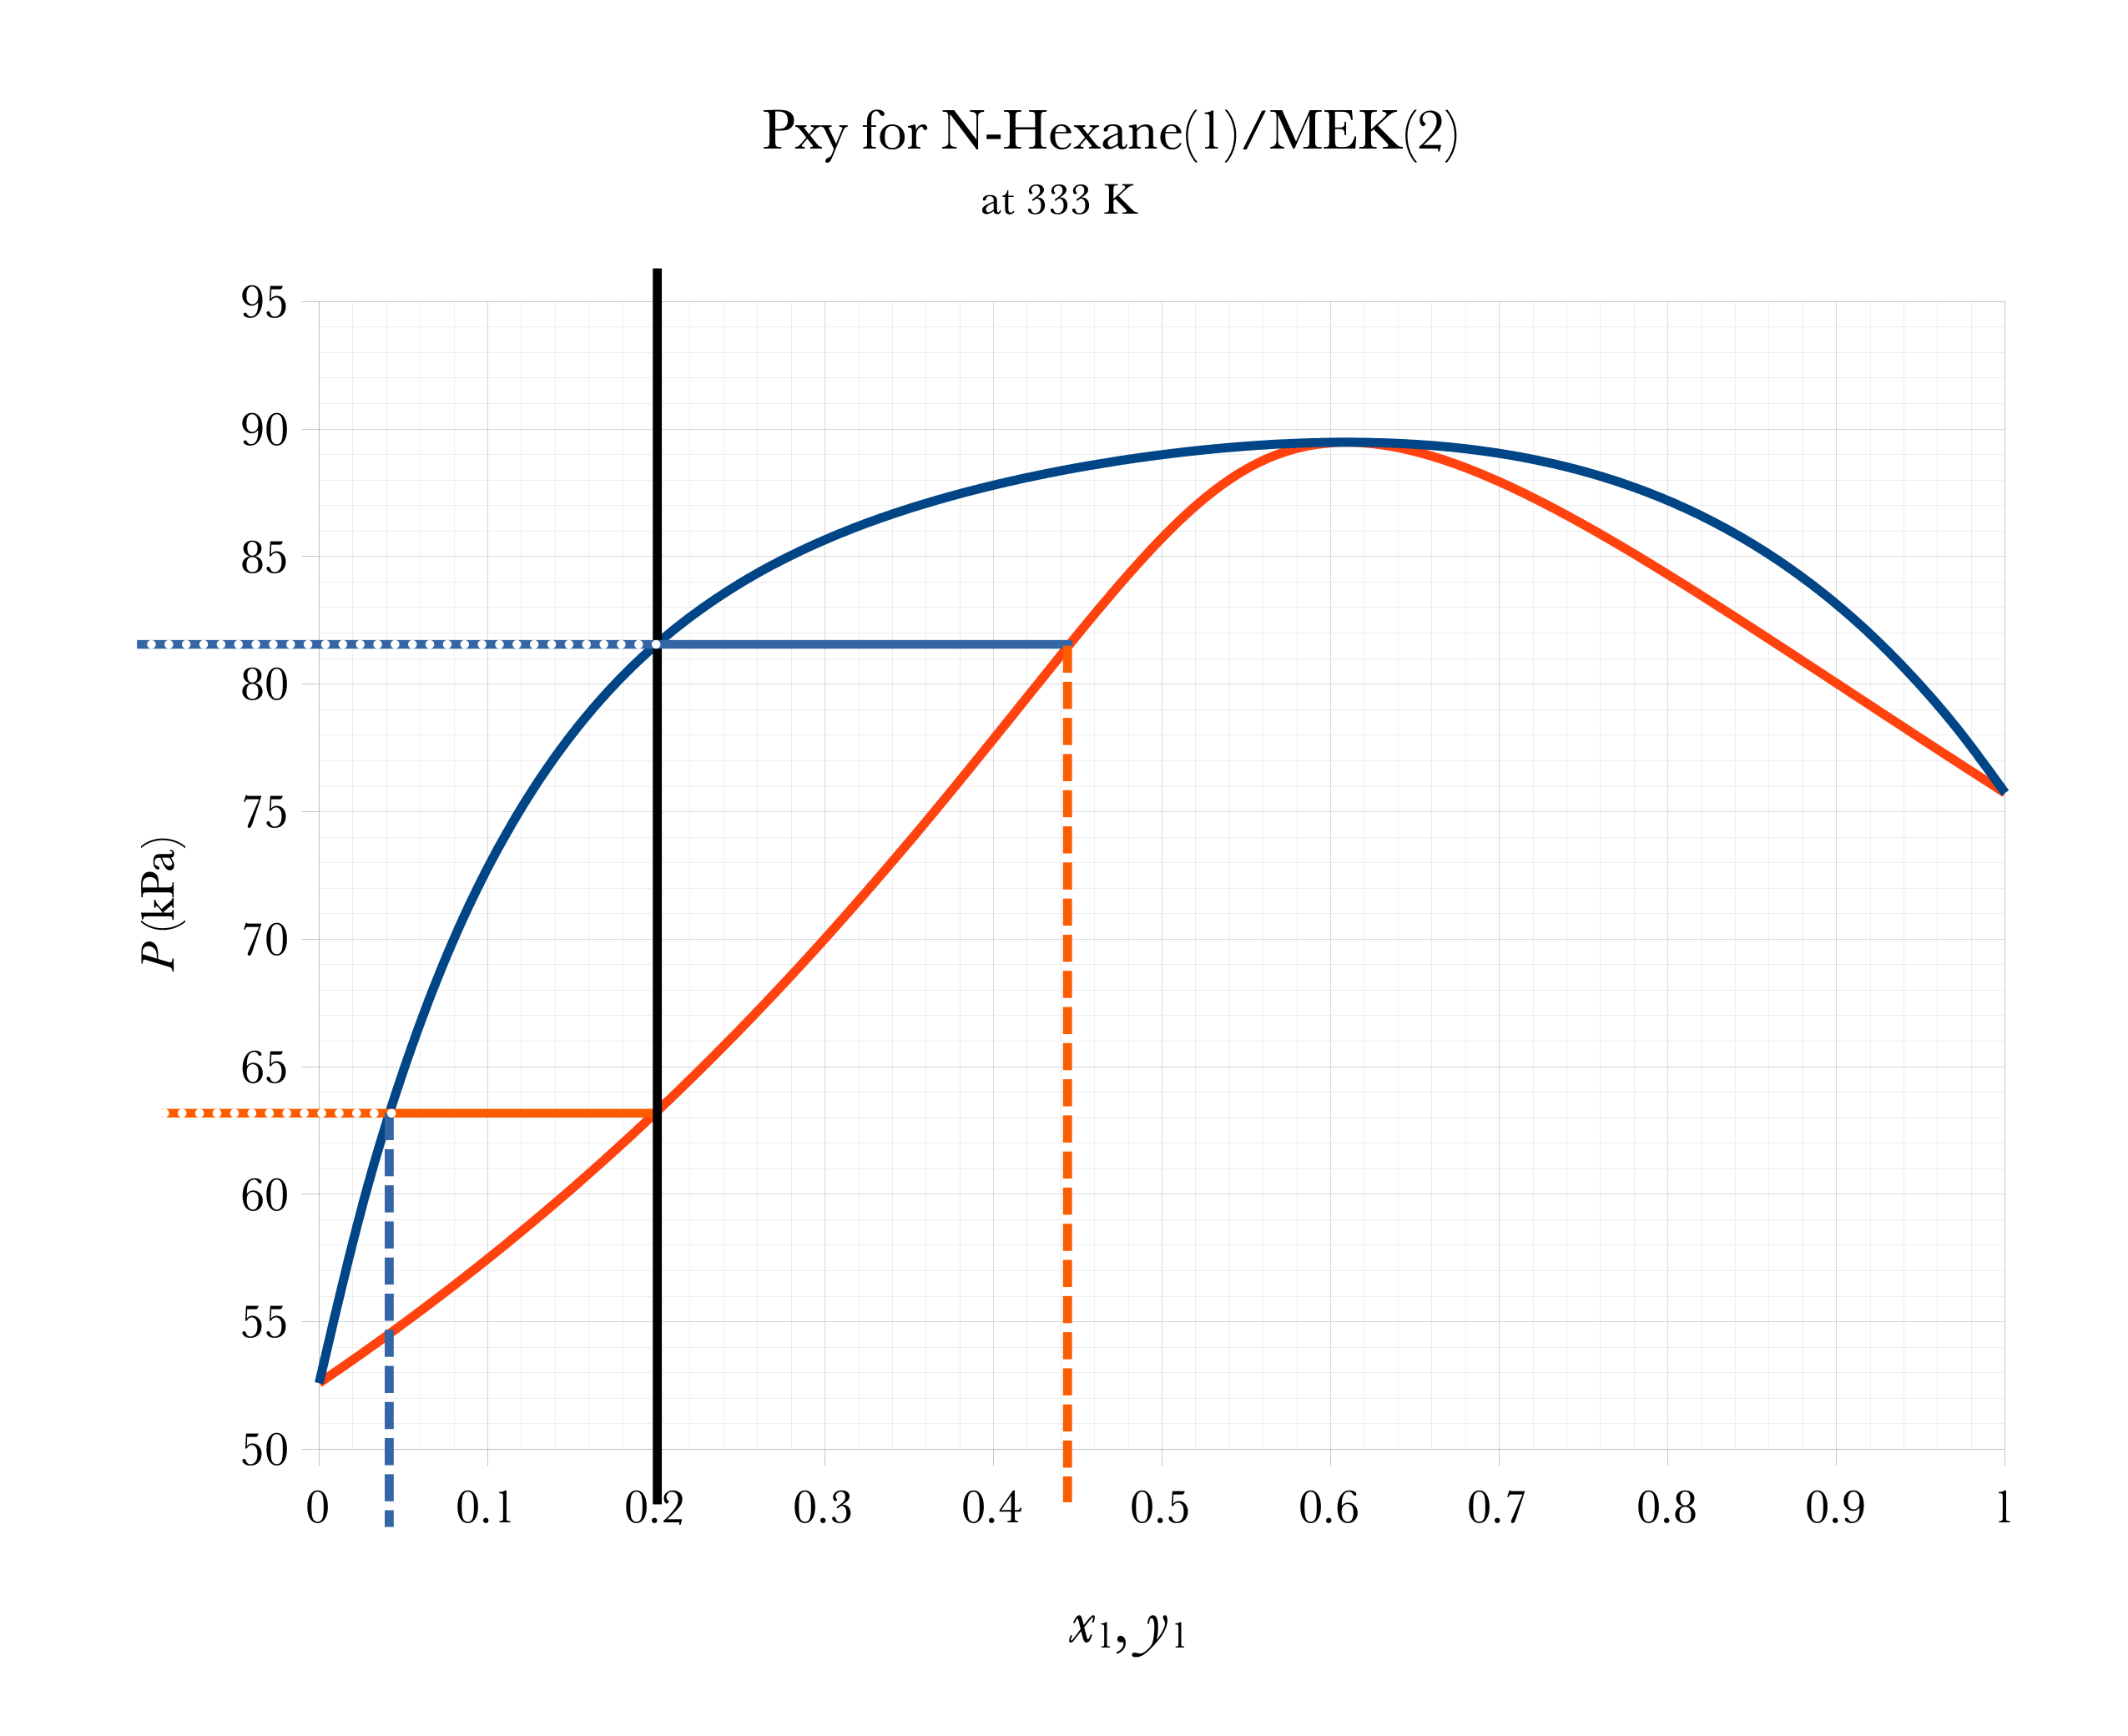
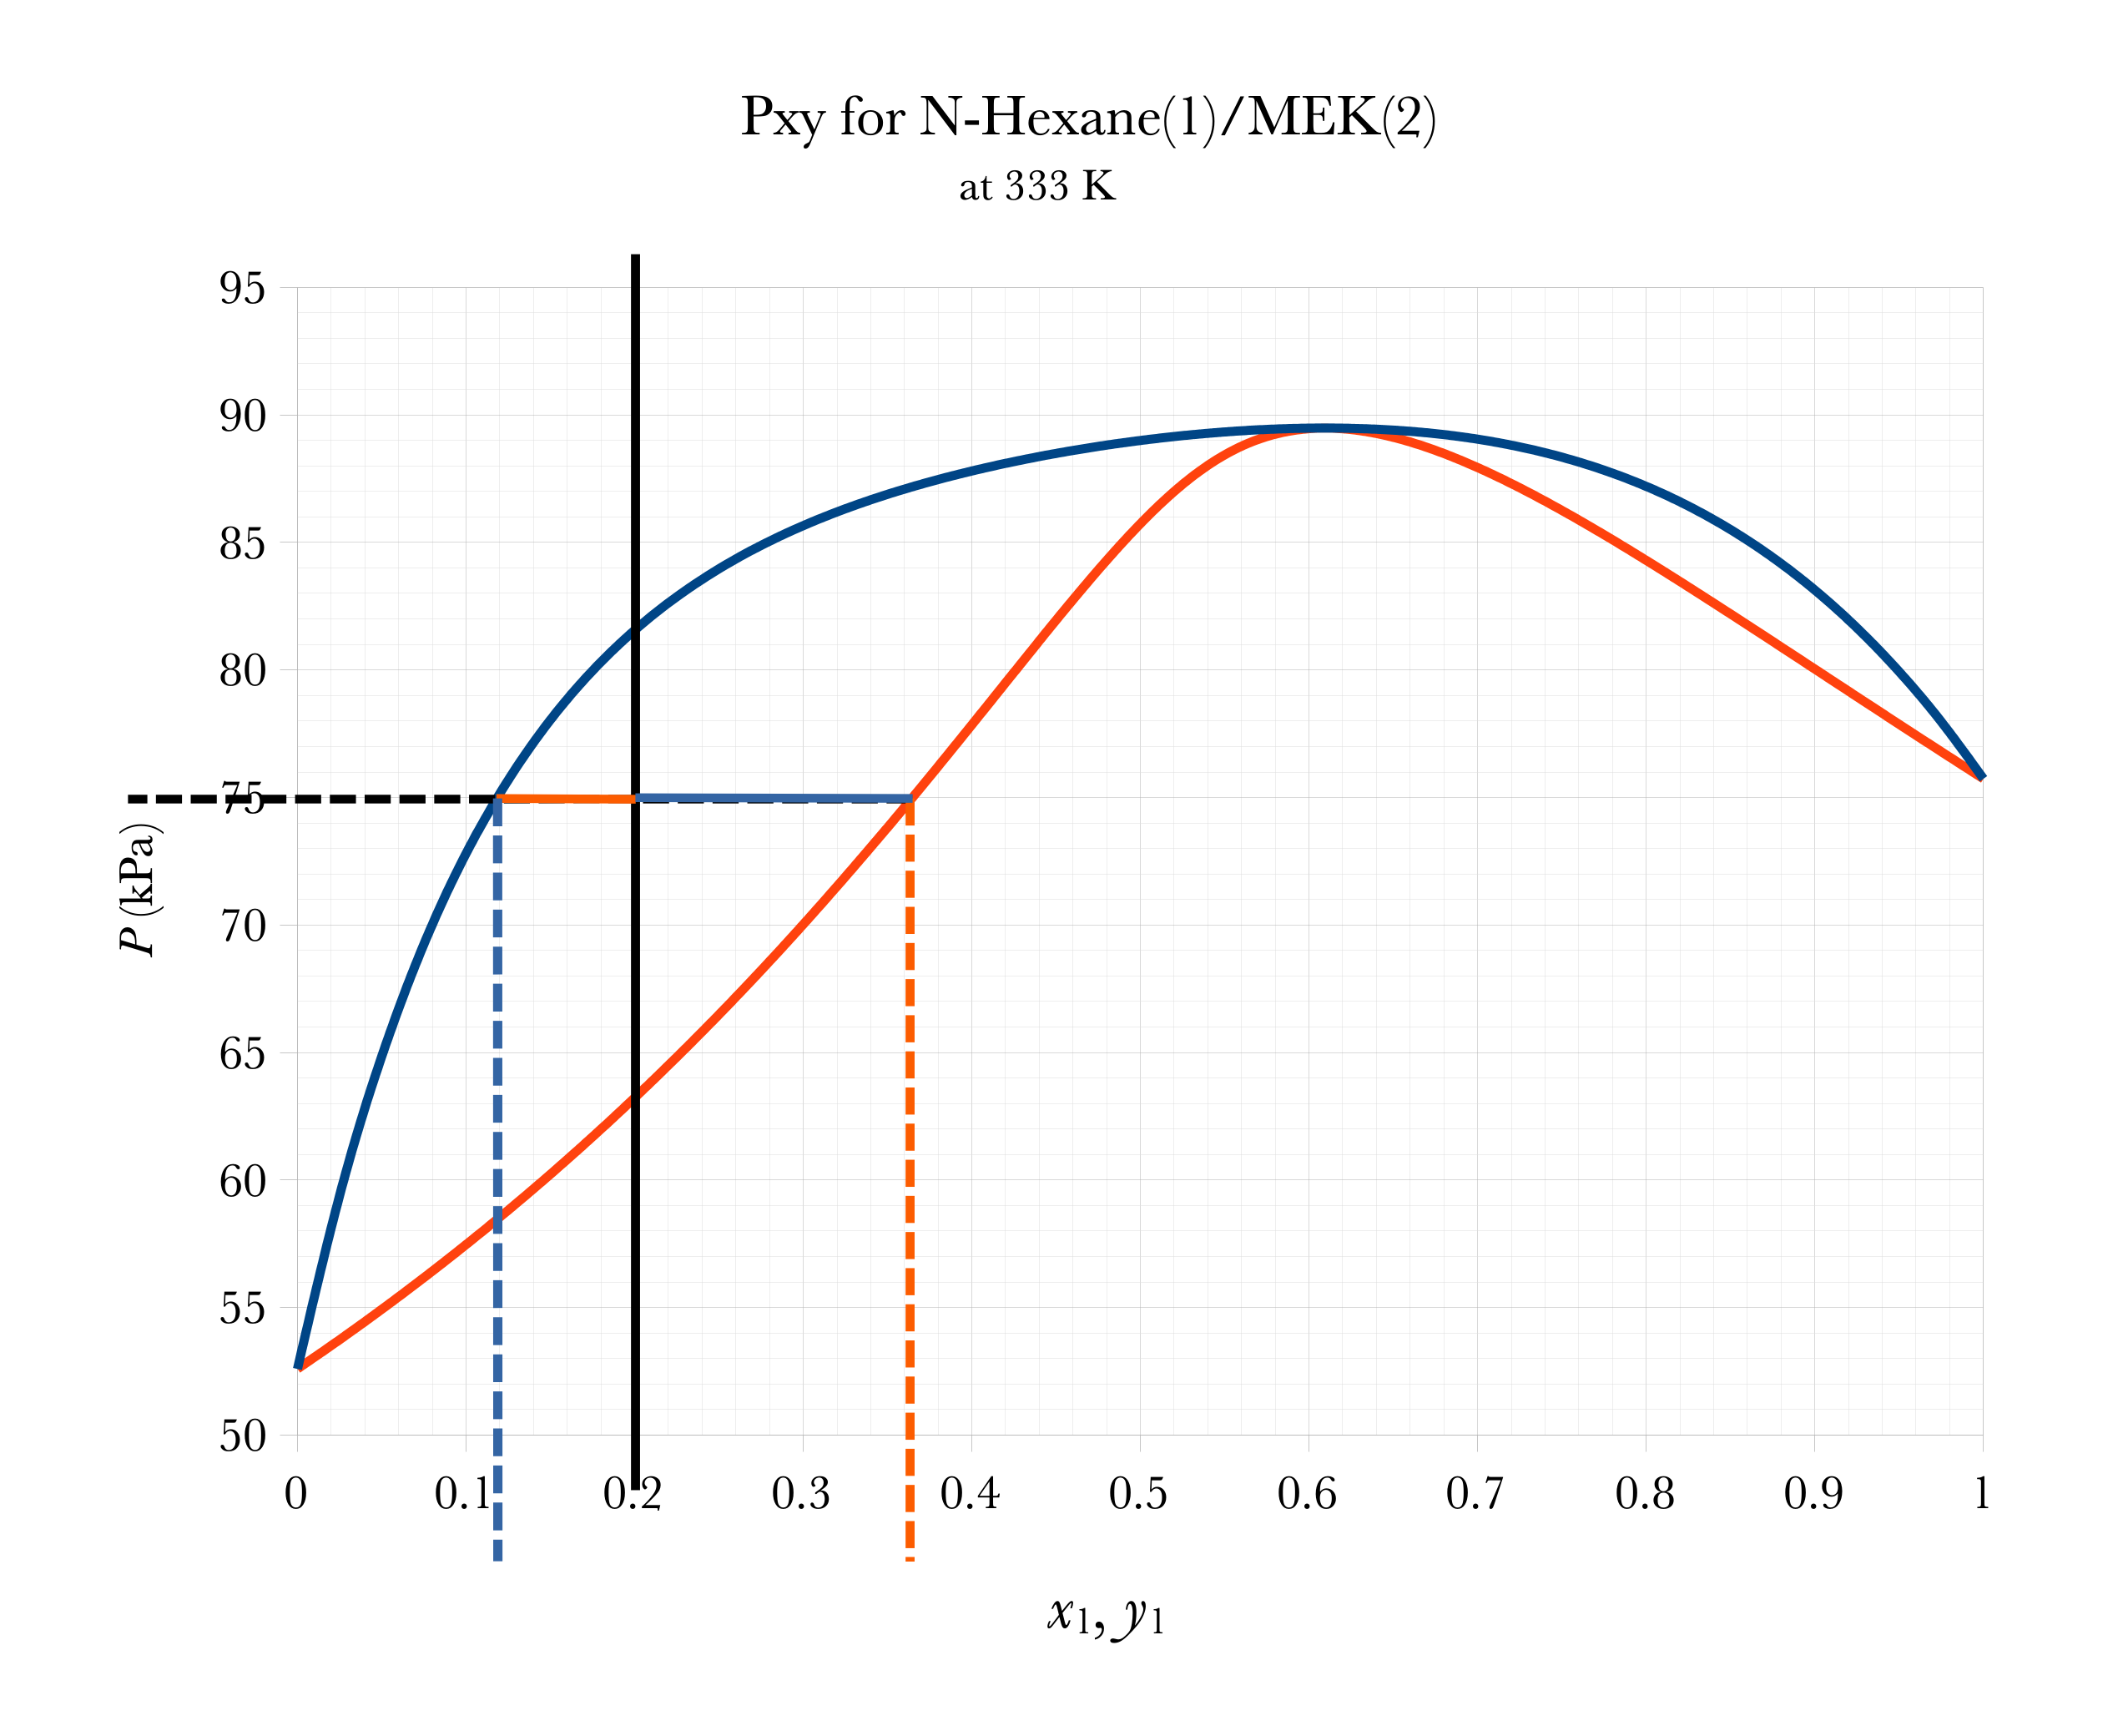
Graphical FLASH on Pxy
Overall
Composition
Subcooled
Liquid
Superheated
Vapor
\(2\text{–}\phi\)
Flash Temperature
Flash
Pressure
Liquid
Composition
Vapor
Composition
\(a\)
\(a \approx 0.20 - 0.12 = 0.08\)
\(b\)
\(b \approx 0.37-0.20 = 0.17\)
\(\mathcal{V} = \dfrac{a}{a+b} \approx 32\%\)
\(\mathcal{L} = 1-\mathcal{V} = \dfrac{b}{a+b} \approx 68\%\)
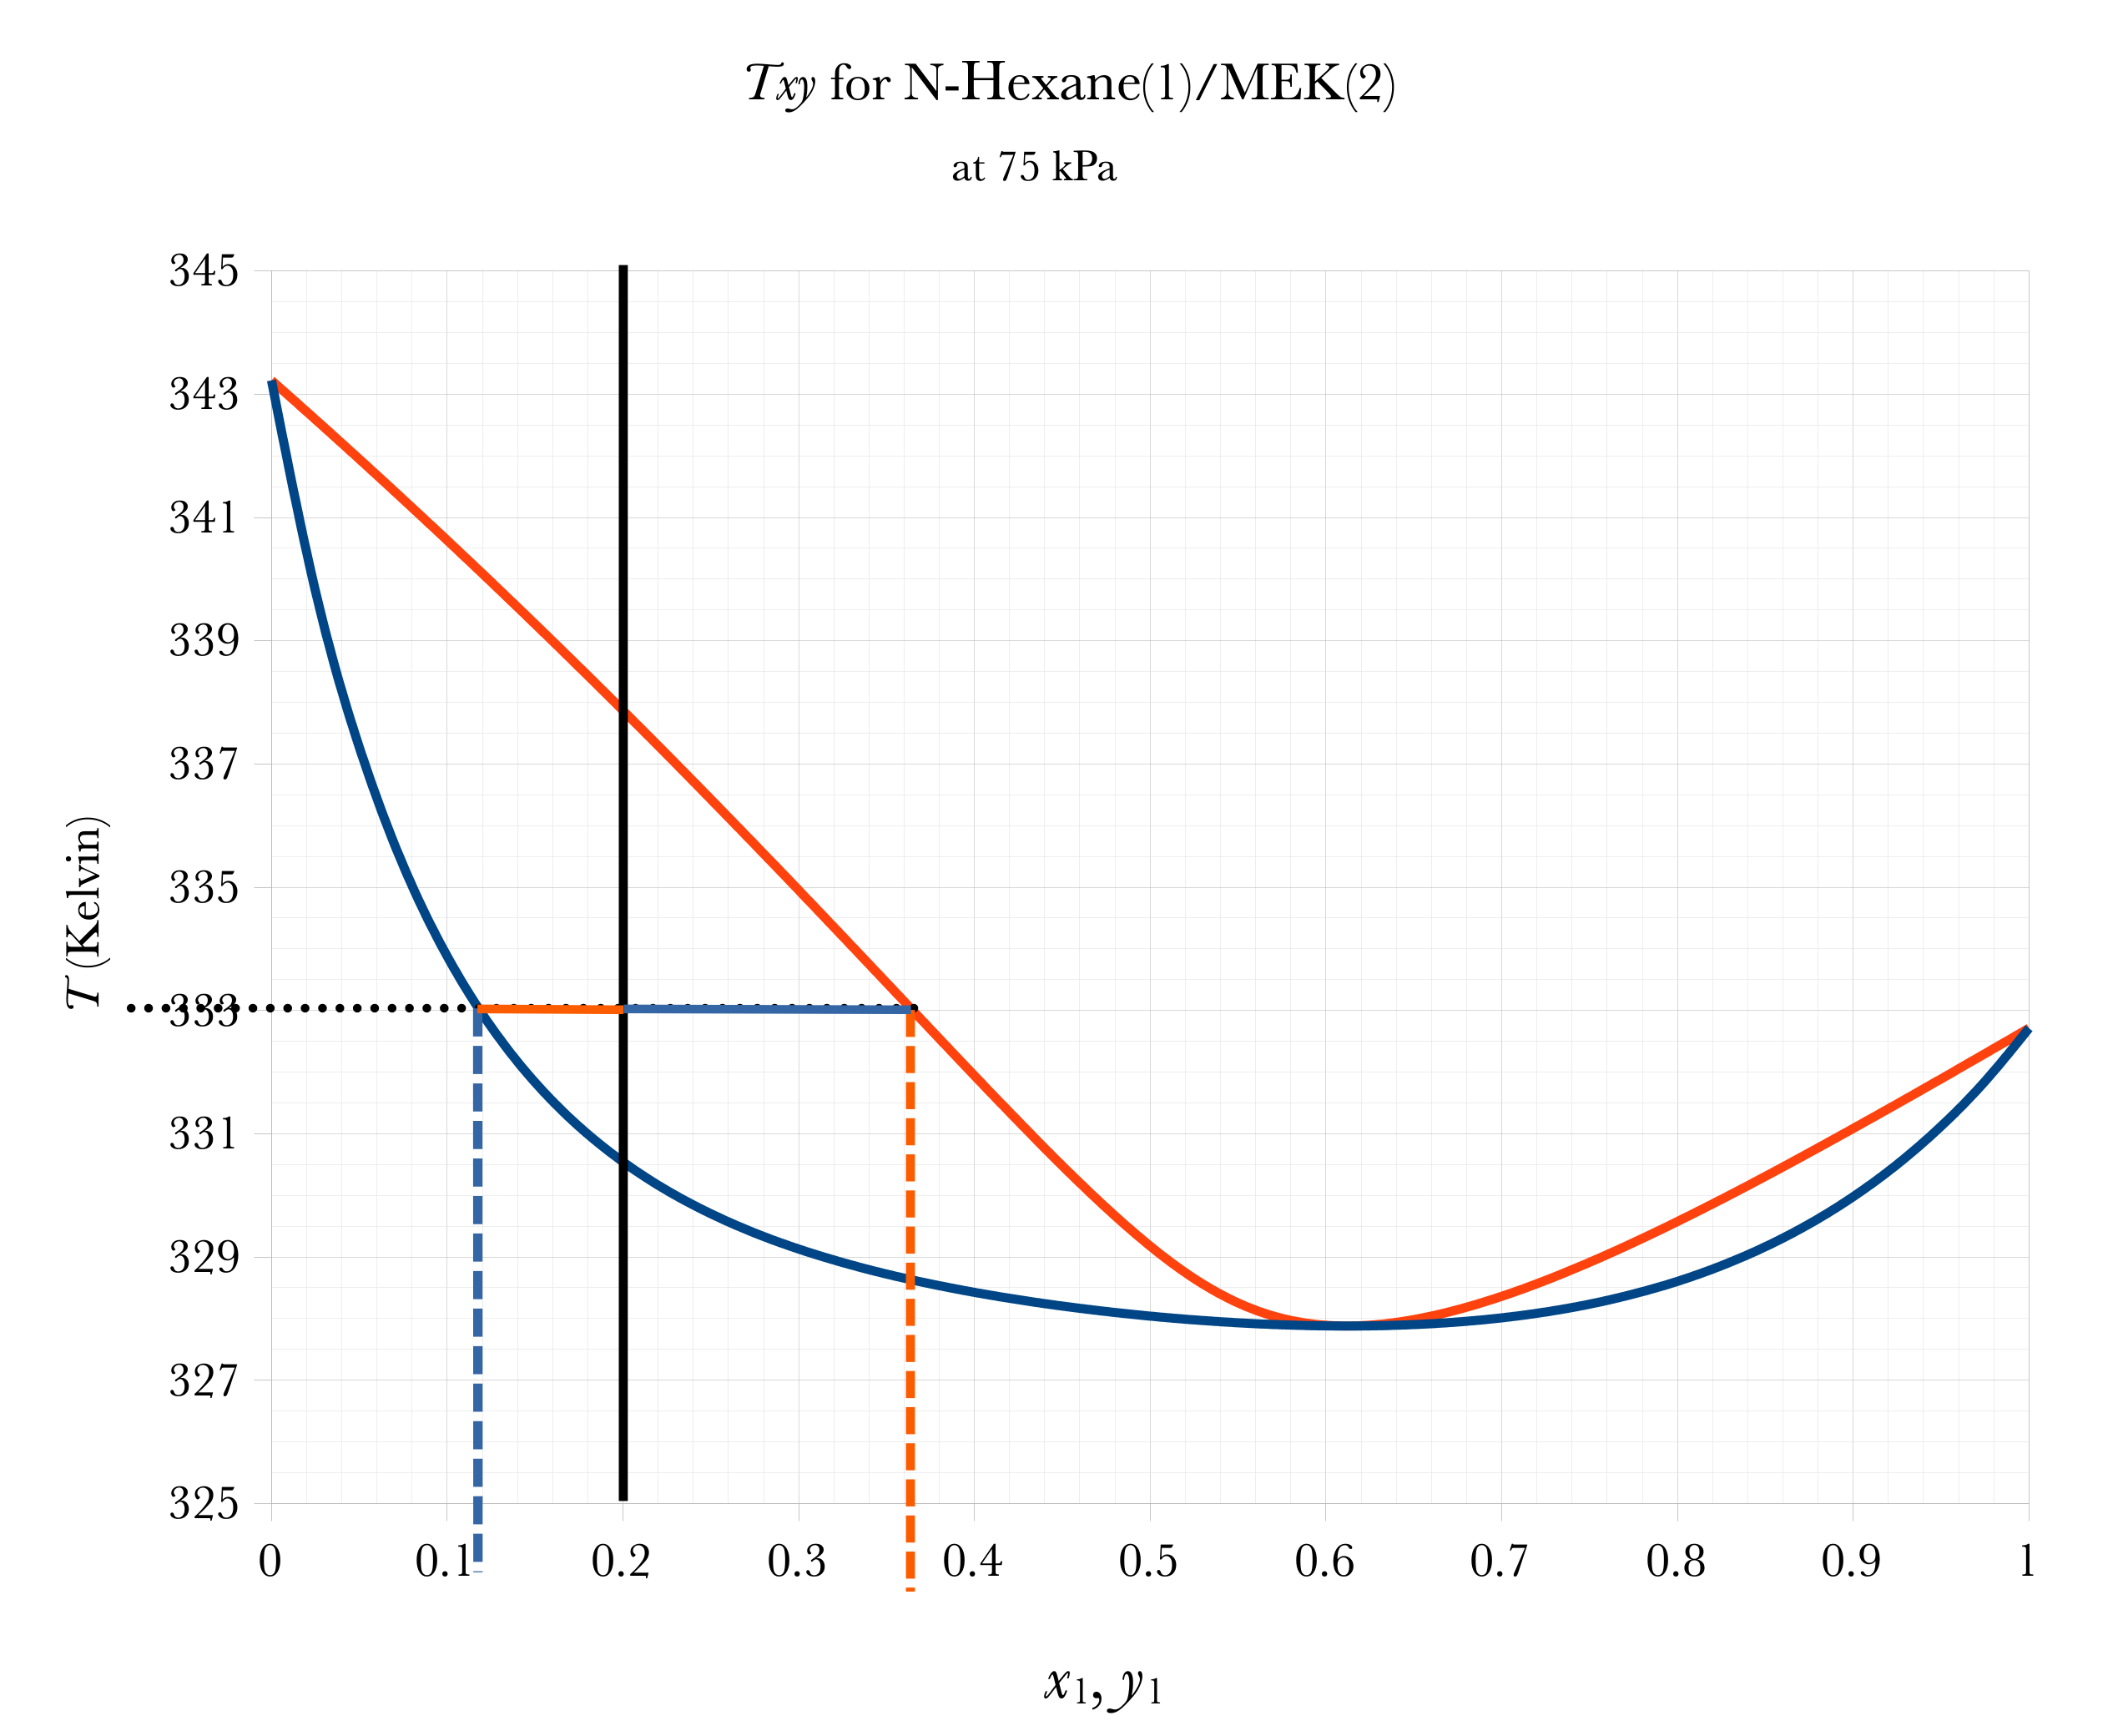
Graphical FLASH on Txy
Overall
Composition
Subcooled
Liquid
Superheated
Vapor
\(2\text{–}\phi\)
Flash Pressure
Flash
Temperature
Liquid
Composition
Vapor
Composition
\(a\)
\(a \approx 0.20 - 0.12 = 0.08\)
\(b\)
\(b \approx 0.37-0.20 = 0.17\)
\(\mathcal{V} = \dfrac{a}{a+b} \approx 32\%\)
\(\mathcal{L} = 1-\mathcal{V} = \dfrac{b}{a+b} \approx 68\%\)
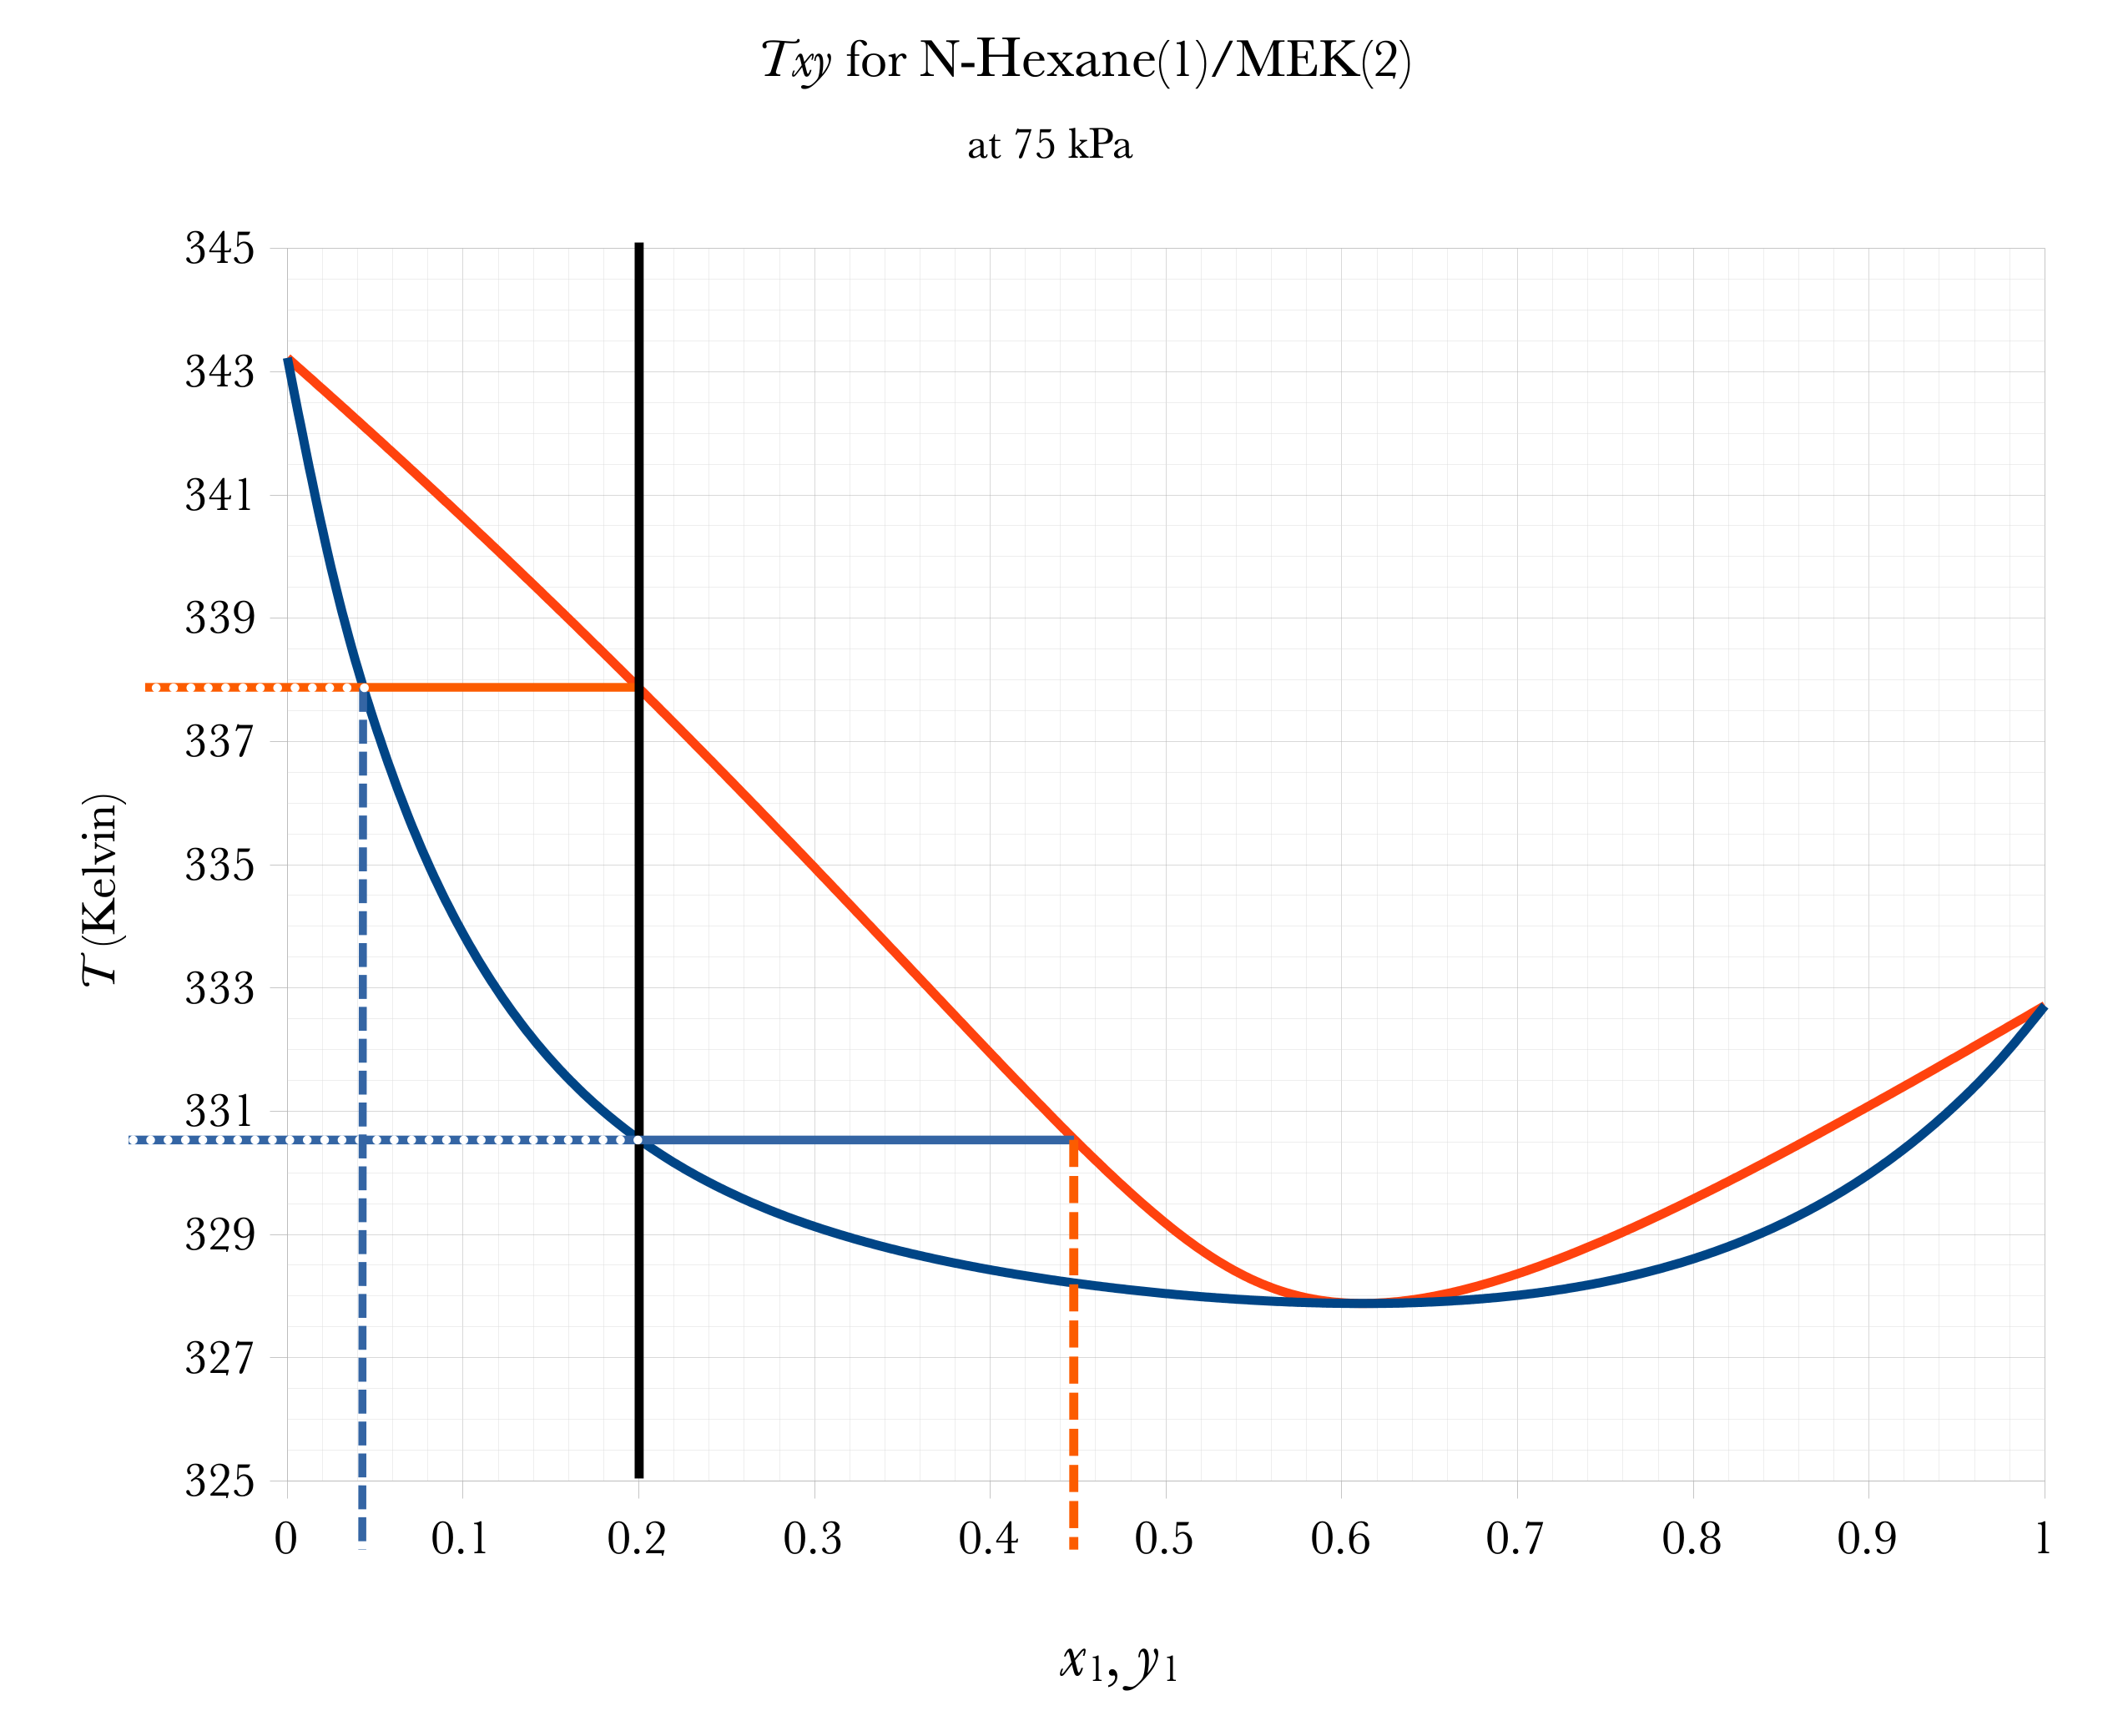
Graphical BUBL T, DEW T
Overall
Composition
Subcooled
Liquid
Superheated
Vapor
\(2\text{–}\phi\)
Dew
Temperature
Dew
Composition
Bubble
Temperature
Bubble
Composition
Low Boiling
Azeotrope
Thanks for watching!
The previous video is in the link in the upper left. The next video in the series, is in the upper right. To learn more about Chemical and Thermal Processes, visit the website linked in the description.