Basic Spreadsheet Techniques
DOFPro Team

Introduction
- The techniques to solve chemical and thermal process problems by using spreadsheets
- How to layout a spreadsheet to clearly convey information
- How to enter formulas with a minimum of effort
- How to use absolute and relative references
- How to make things easier
Why Spreadsheets?
- Readily Available
- Libre Office is free.
- Google Sheets is “free” and collaborative but lacking features.
We will use Libre Office.
- Tabular format fits process flow diagram annotation.
- Easy to correct errors (if you set it up right).
- Goal Seek (nonlinear root finder)
- Solver (nonlinear regression)
Formatting
- For professional use, you can get very fancy.
- When beginning, just make things clear, not fancy.
- Think about layout from end-consumer’s perspective.
- Label things in an obvious way.
- Group things in an obvious way.
- Code reference data, input parameters, and answers.
- The DOFPro code is:
- Input parameters (what the user can change) Green (or Red)
- Reference data (e.g., \(R\), data from table) Blue
- Answers or results, BOLD
- The DOFPro code is:
Formatting Graphs
All graphs must have:
- Units on the axes (ln(1-CP/CA0) is unitless.)
- Legends if more than one data series plotted
Spreadsheet Demo Problem
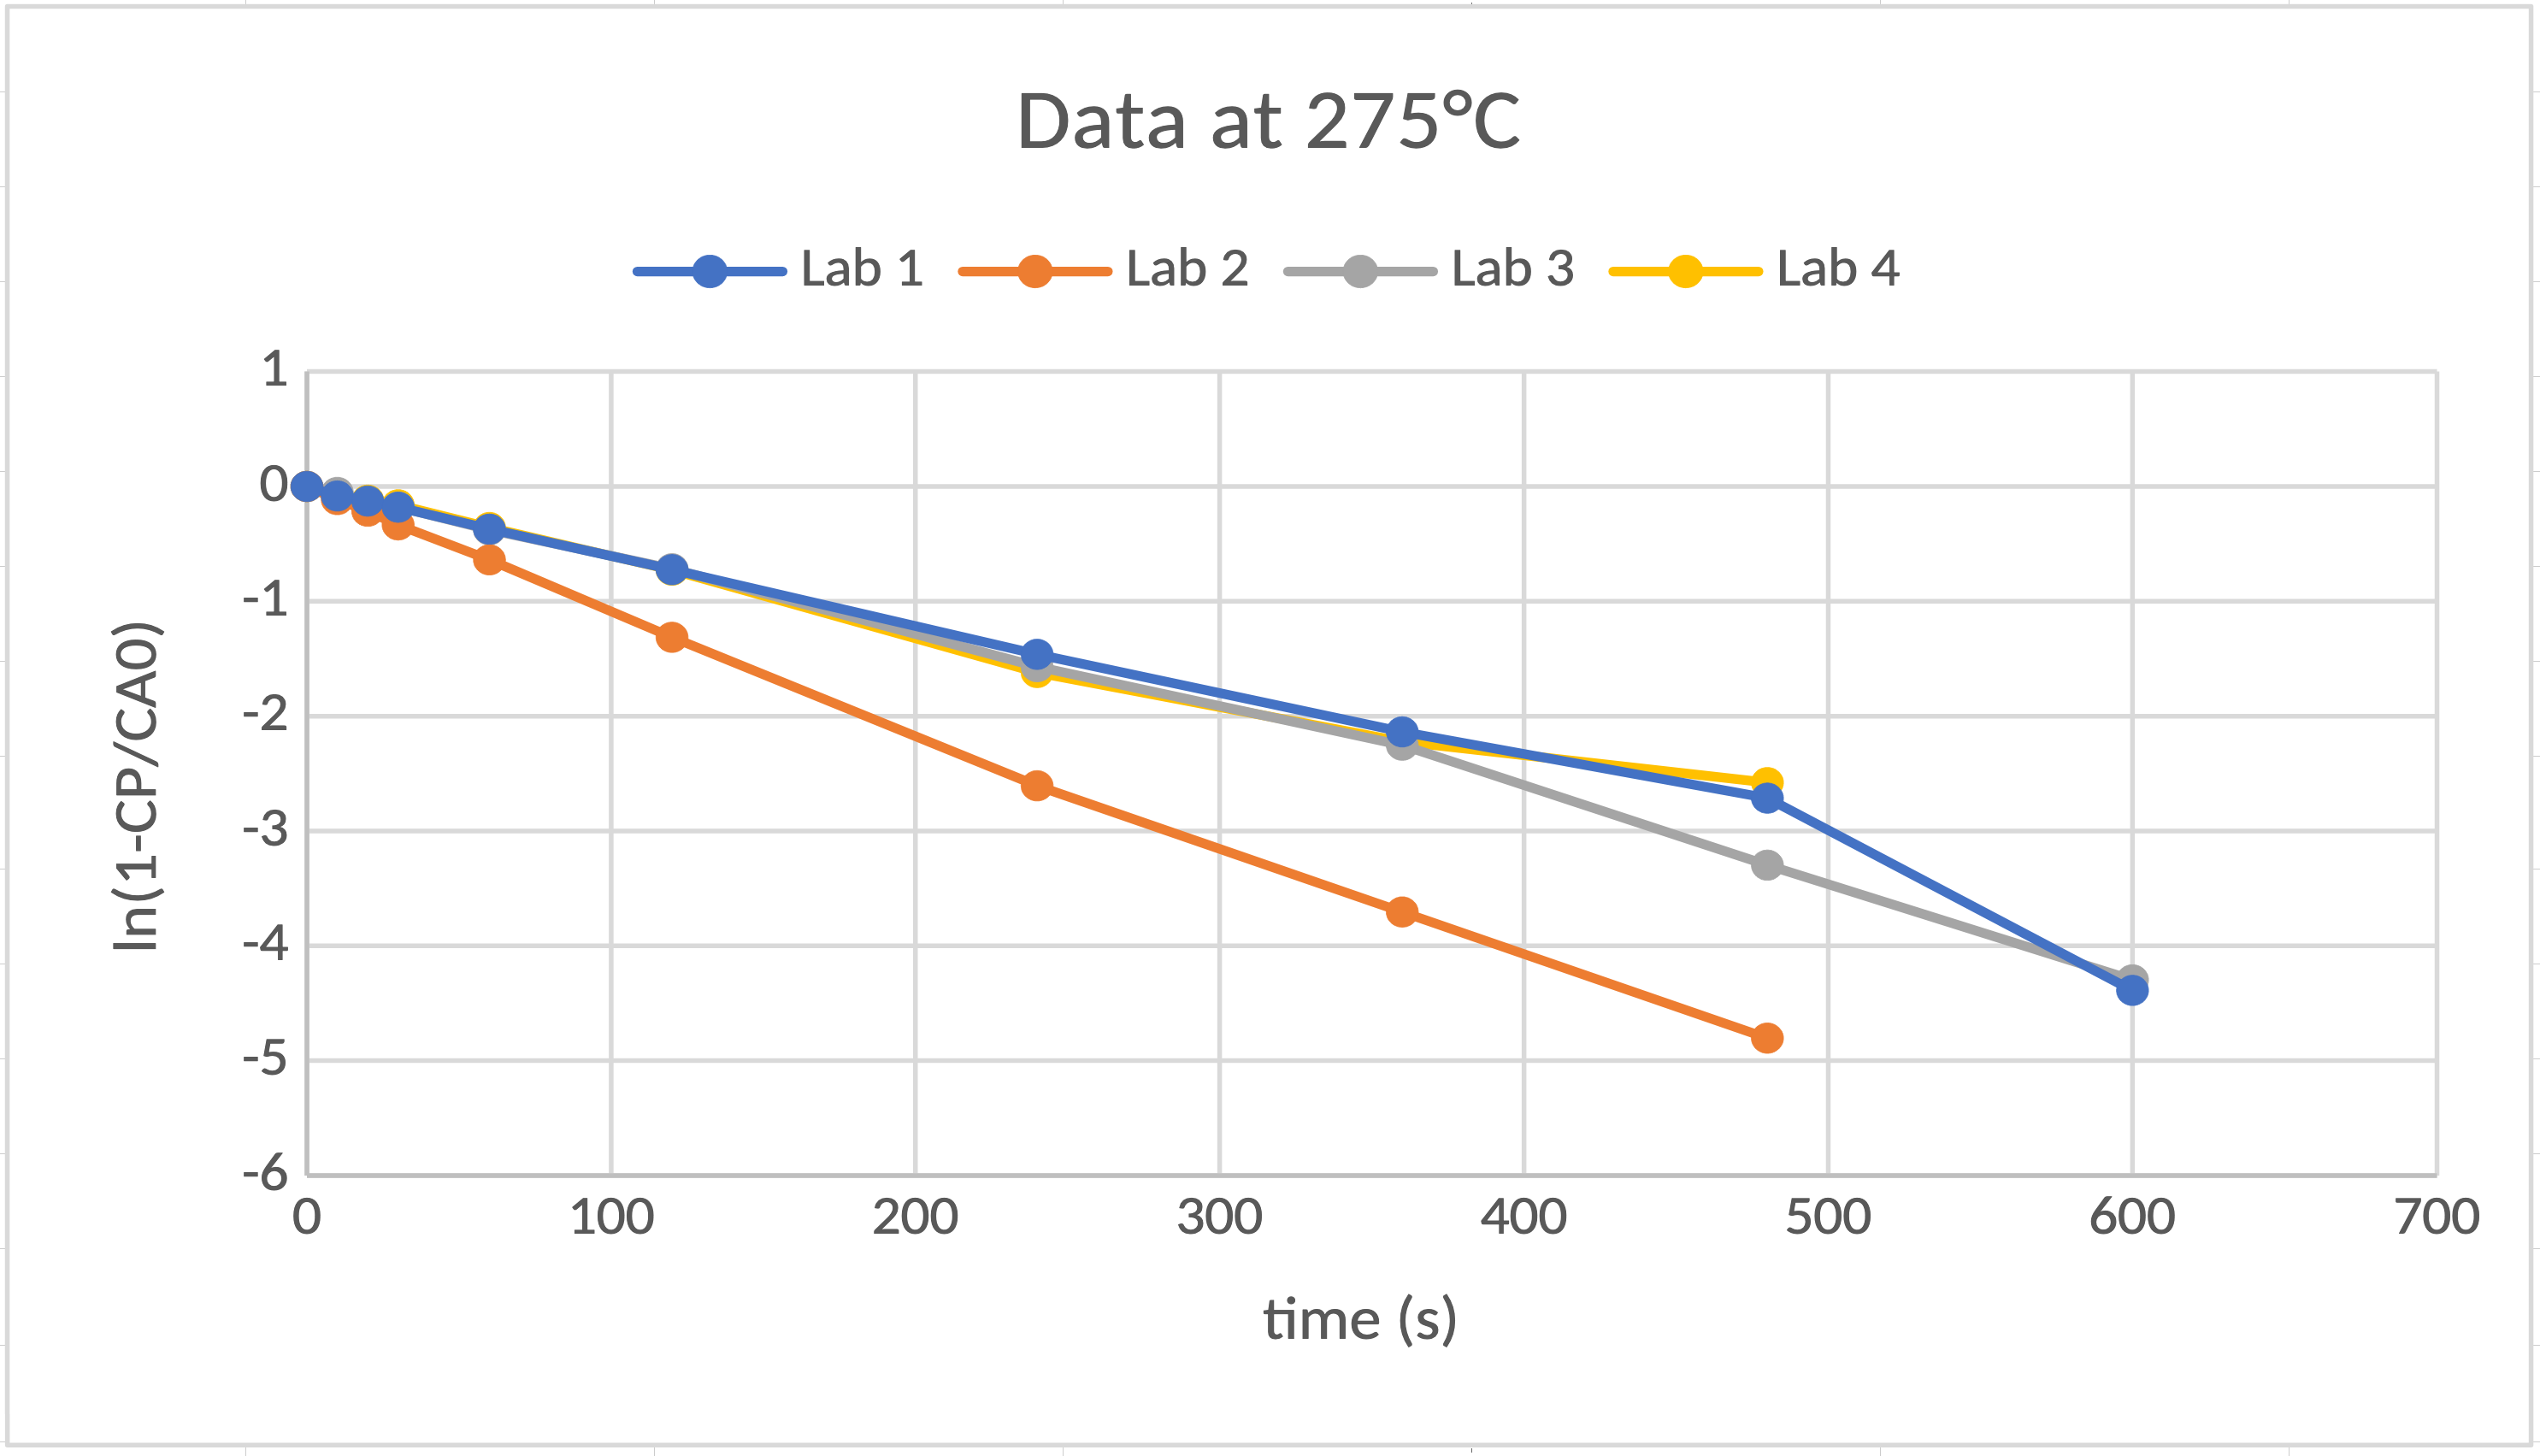
The chemical reaction, \(\mathrm{A} \rightarrow \mathrm{B}\), has been studied and has been found to be a first-order reaction. In a constant-volume chemical reactor, if you start with a fixed initial concentration of \(\mathrm{A}\), \(C_\mathrm{A0}\), in grams per liter and no \(\mathrm{B}\), \(C_\mathrm{B}\), will evolve in time as \(C_\mathrm{B} = C_\mathrm{{A0}}(1-e^{- kt})\), where \(t\) is time in seconds and \(k\) is the rate constant or rate coefficient in units of per seconds. Your company hired four research labs to study the kinetics of the reaction at five different temperatures, 265 °C, 270 °C, 275 °C, 280 °C and 285 °C. The research labs have returned data tables that have \(T\), \(C_\mathrm{A0}\), and \(C_\mathrm{B}(t)\).
- Plot the data.
- Find the best value for \(k\) at each \(T\).
- Determine \(A\) and \(E_a\) for the data.
- Evaluate the quality of the data for each lab.
Spreadsheet Demo Problem (cont.)
Start with
\[C_\mathrm{B} = C_\mathrm{{A0}}(1-e^{- kt})\]
Divide by \(C_\mathrm{{A0}}\)
Isolate \(e^{- kt}\)
\[1-\frac{C_\mathrm{B}}{C_\mathrm{{A0}}}=e^{- kt}\]
\[\ln \left(1-\frac{C_\mathrm{B}}{C_\mathrm{{A0}}}\right) = -kt\]
Plot \(\ln \left(1-\frac{C_\mathrm{B}}{C_\mathrm{{A0}}}\right)\) versus \(t\).
\(\mathrm{slope}=-k\)
Arrhenius Parameters
\[k=A e^{-E_a/(RT)}\]
\(A\) is the pre-exponential or frequency factor.
\(E_a\) is the activation energy.
\[\ln{k}=\ln{A}-\frac{E_a}{RT}\]
Plot \(\ln k\) versus \(1/T\).
\(\mathrm{slope}=-\frac{E_a}{R}\)
\(\mathrm{intercept}=\ln{A}\)
\(E_a=-\mathrm{slope} \cdot R\)
\(A = \exp{(\mathrm{intercept})}\)
Spreadsheet Demo
{image}
Takeaways
- With proper planning, you can arrange a spreadsheet to minimize formula entry and overall effort.
- Think through absolute and relative references and lay out your spreadsheet so that you can use them to minimize the number of times you need to enter a formula.
- Click-filling and/or “copy once/paste many” can really minimize your effort.
- When starting out, don’t worry about detailed formatting with superscripts, subscripts, special symbols, and italics.
- Code your information with colors and bolding to make it easier for people using your spreadsheets to find the information they want.
Thanks for watching!
The Full Story companion video is in the link in the upper left. The next video in the series, is in the upper right. To learn more about Chemical and Thermal Processes, visit the website linked in the description.
![]()