How to Have a Quickie with Your Data Part 1
DOFPro Team

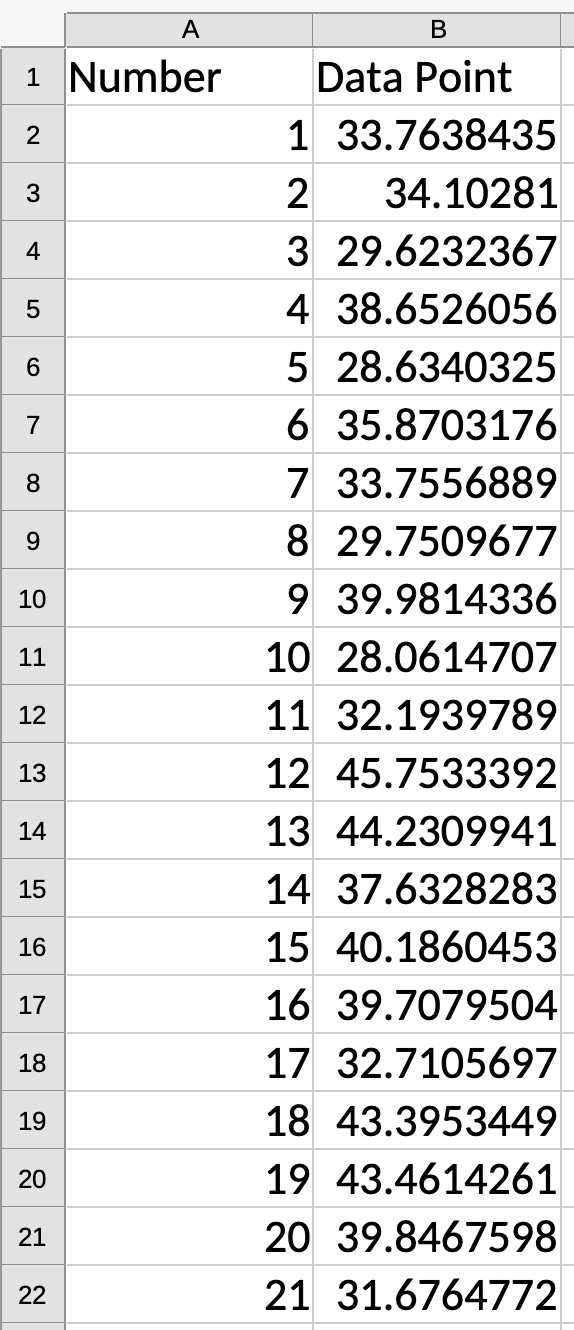
Demo for Average and Std. Dev.
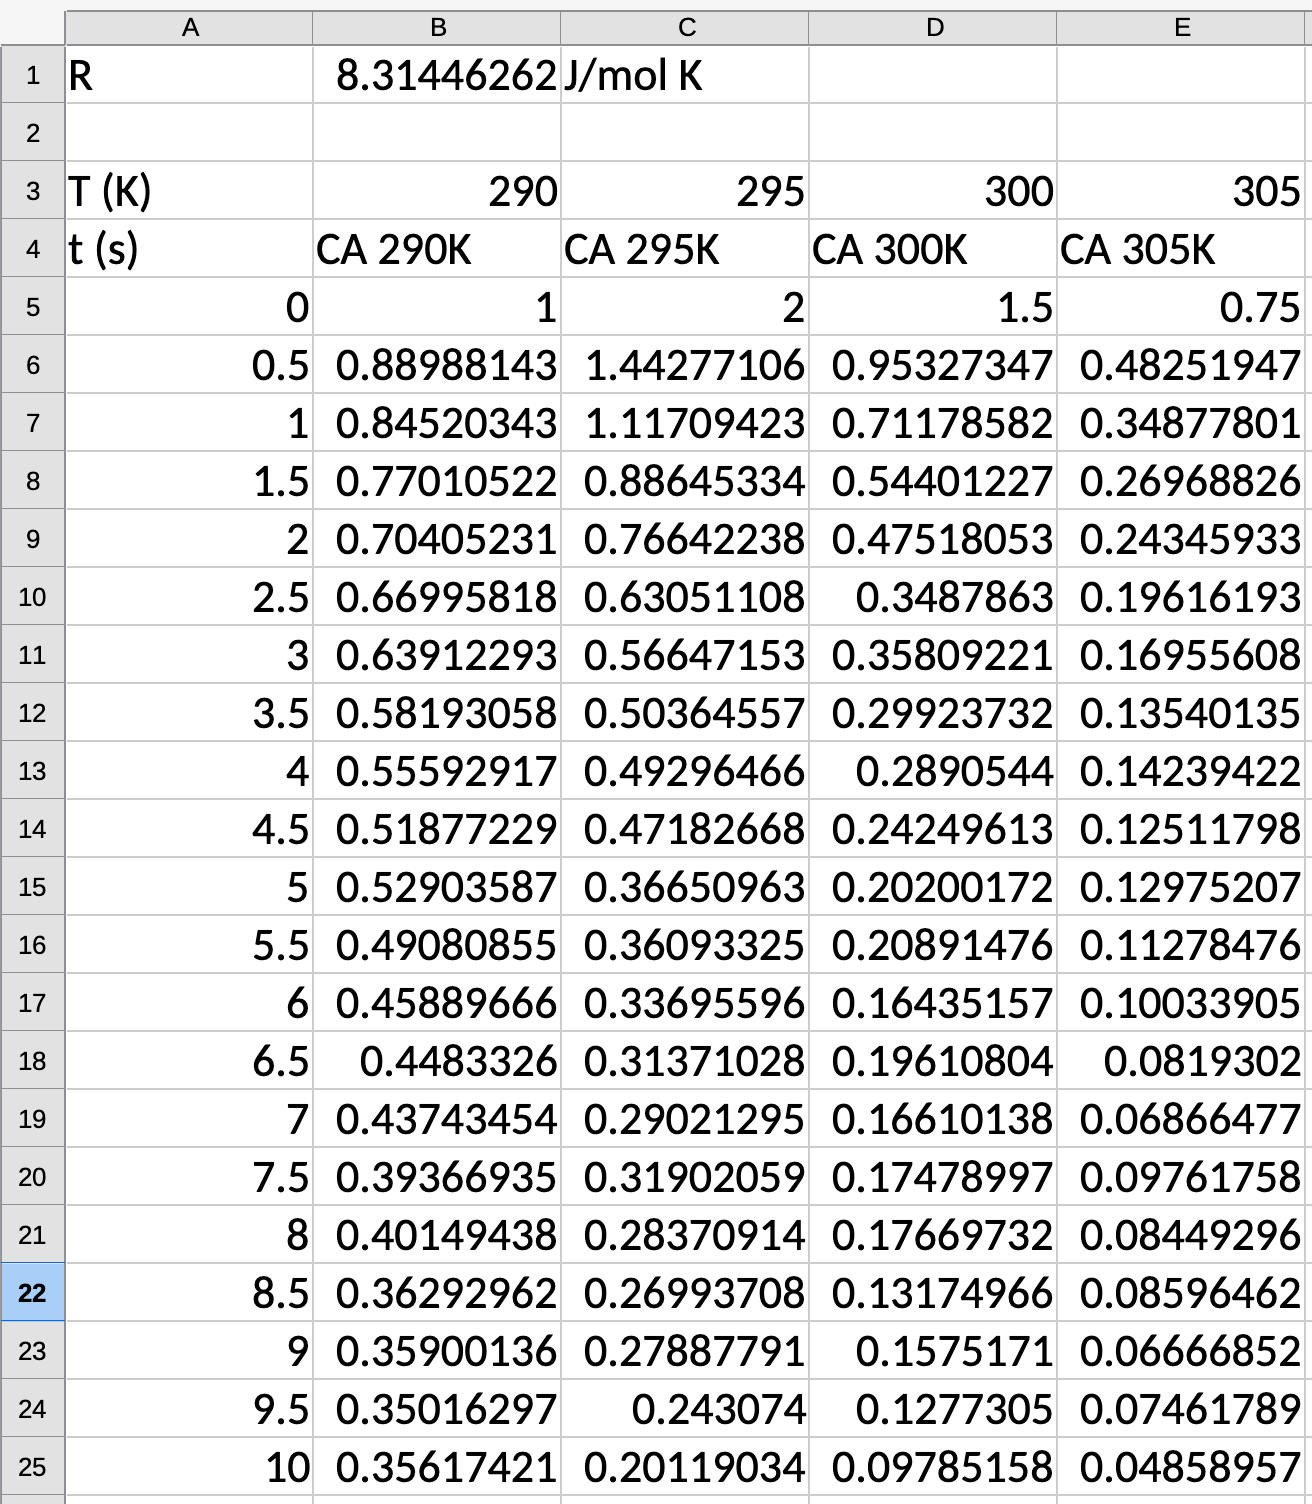
Demo for Slope and Intercept
Have data for \(2^\mathrm{nd}\)-order kinetics. Fit for \(C_{\mathrm{A}0}\), \(k\), \(k_0\), and \(E_A\).
\[C_\mathrm{A} = \dfrac{C_{\mathrm{A}0}}{1+C_{\mathrm{A}0} kt}\]
\[\dfrac{1}{\mathrm{C}_A} = \dfrac{1}{C_{\mathrm{A}0}} + kt\]
\[\mathrm{slope} = k\]
\[\mathrm{intercept} = \dfrac{1}{C_{\mathrm{A}0}}\]
Thanks for watching!
The previous video in the series is the link in the upper left. The next video in the series is the link the upper right. To learn more about Chemical and Thermal Processes, visit the website linked in the description.