How to Have a Quickie with Your Data Part 2
DOFPro Team

Nonlinear Demo for Solver
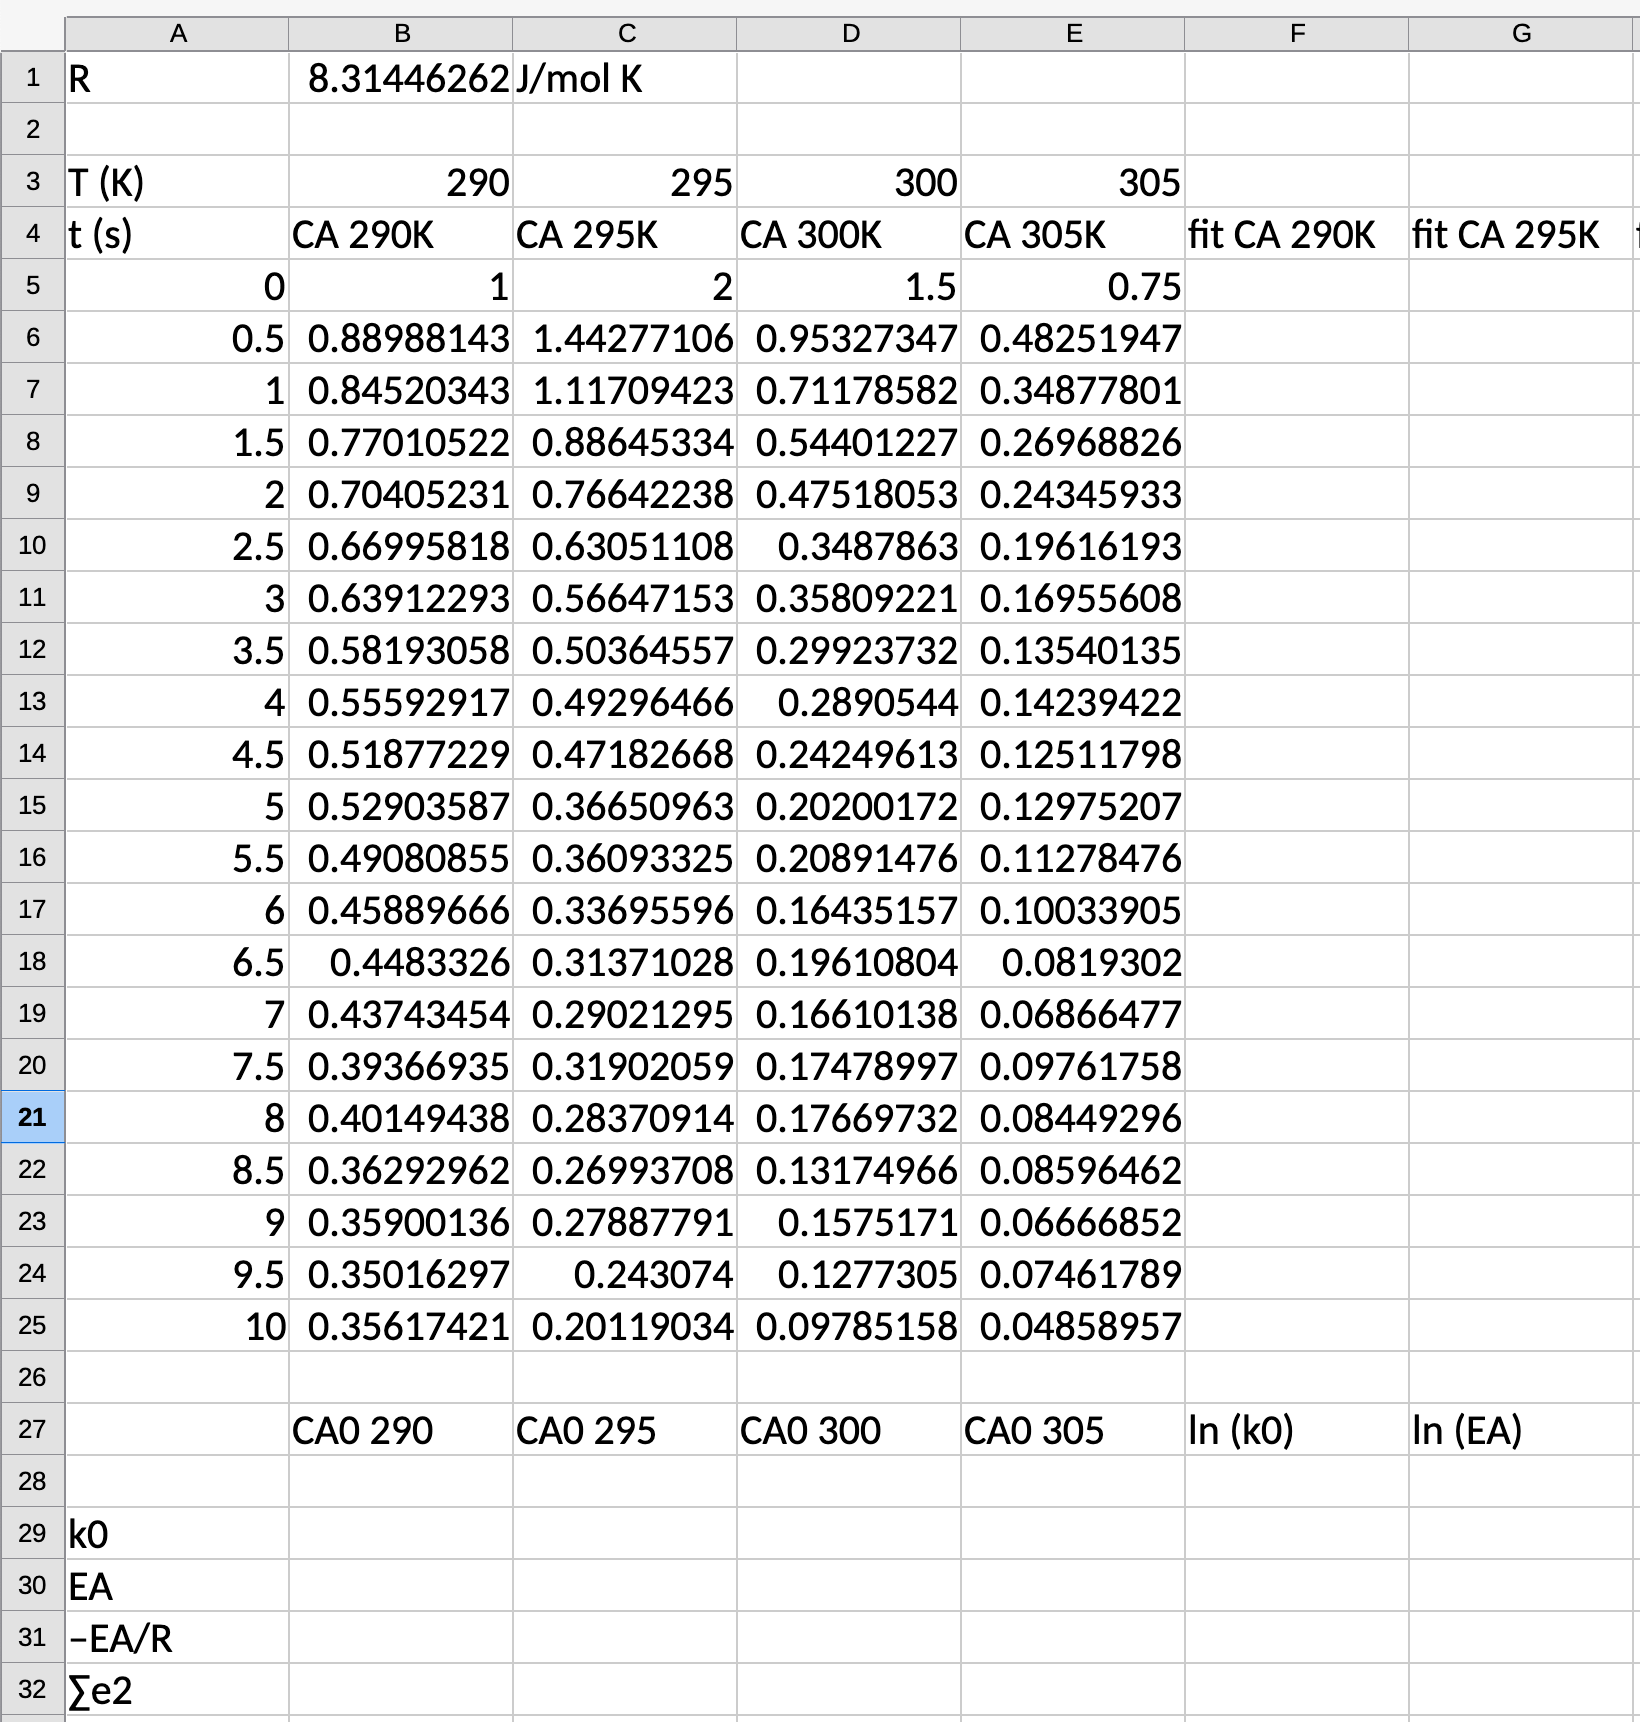
Have data for 2\(^\mathrm{nd}\)-order kinetics. Fit for \(C_\mathrm{{A}0}\), \(k\), \(k_0\), and \(E_A\).
- Set up fitting function
- Set up array of fitting values. Keep magnitudes roughly equal.
- Calculate \(\Sigma{(y_i – y_{i\text{-fit}})^2}\). SSE
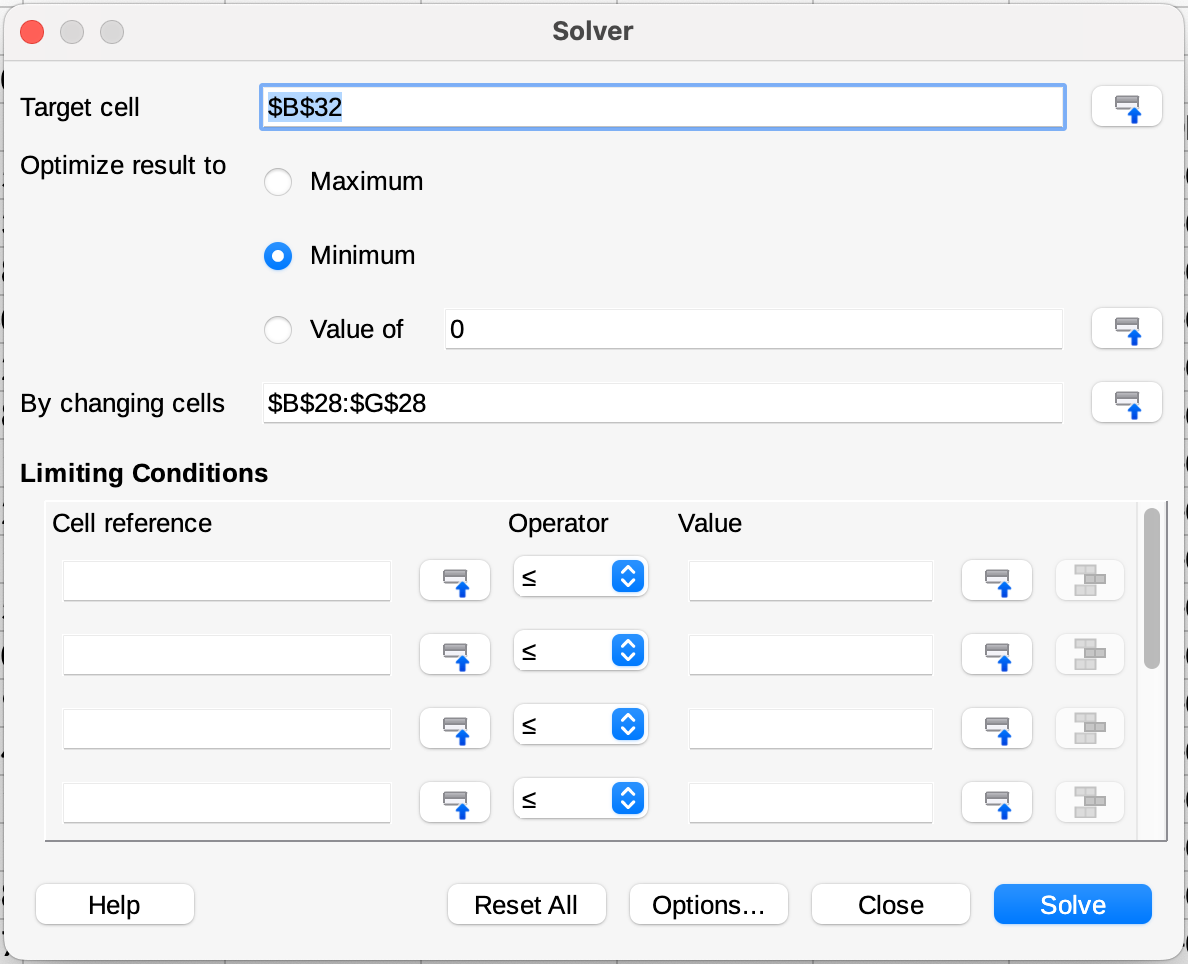
- Minimize with Solver
Nonlinear Demo for Solver
Have data for 2\(^\mathrm{nd}\)-order kinetics. Fit for \(C_\mathrm{{A}0}\), \(k\), \(k_0\), and \(E_A\).
- Set up fitting function
- Set up array of fitting values. Keep magnitudes roughly equal.
- Calculate \(\Sigma{(y_i – y_{i\text{-fit}})^2}\). SSE
- Minimize with Solver.
\[C_{\text{A-fit}} = \frac{C_{\text{A0-fit}}}{1+C_{\text{A0-fit}} {k_\mathrm{fit}}t}\]
\[k_\mathrm{fit} = k_{0\text{-fit}} \exp\left({\frac{-E_{A\text{-fit}}}{RT}}\right)\]
Nonlinear Demo for Solver
Have data for 2\(^\mathrm{nd}\)-order kinetics. Fit for \(C_\mathrm{{A}0}\), \(k\), \(k_0\), and \(E_A\).
- Set up fitting function
- Set up array of fitting values. Keep magnitudes roughly equal.
- Calculate \(\sum {(y_i – y_{i\text{-fit}})^2}\). SSE
- Minimize with Solver.
Nonlinear Demo for Solver
Have data for 2\(^\mathrm{nd}\)-order kinetics. Fit for \(C_\mathrm{{A}0}\), \(k\), \(k_0\), and \(E_A\).
- Set up fitting function
- Set up array of fitting values. Keep magnitudes roughly equal.
- Calculate \(\mathbf{\Sigma{(\mathit{y_i - y}_{\mathit{i}\text{-fit}})^2}}\). SSE
- Minimize with Solver.
\[\mathrm{SSE} = \Sigma{(C_{\mathrm{A}_i}- C_{\text{A-fit}_i})^2}\]
\[(C_{\mathrm{A}_i} - C_{\text{A-fit}_i})^2 = (C_{\mathrm{A}_i} - \dfrac{C_{\text{A0-fit}}}{1+C_{\text{A0-fit}} {k_\mathrm{fit}}t_i})^2\]
Nonlinear Demo for Solver
Have data for 2\(^\mathrm{nd}\)-order kinetics. Fit for \(C_\mathrm{{A}0}\), \(k\), \(k_0\), and \(E_A\).
- Set up fitting function
- Set up array of fitting values. Keep magnitudes roughly equal.
- Calculate \(\Sigma{(y_i – y_{i\text{-fit}})^2}\). SSE
- Minimize with Solver
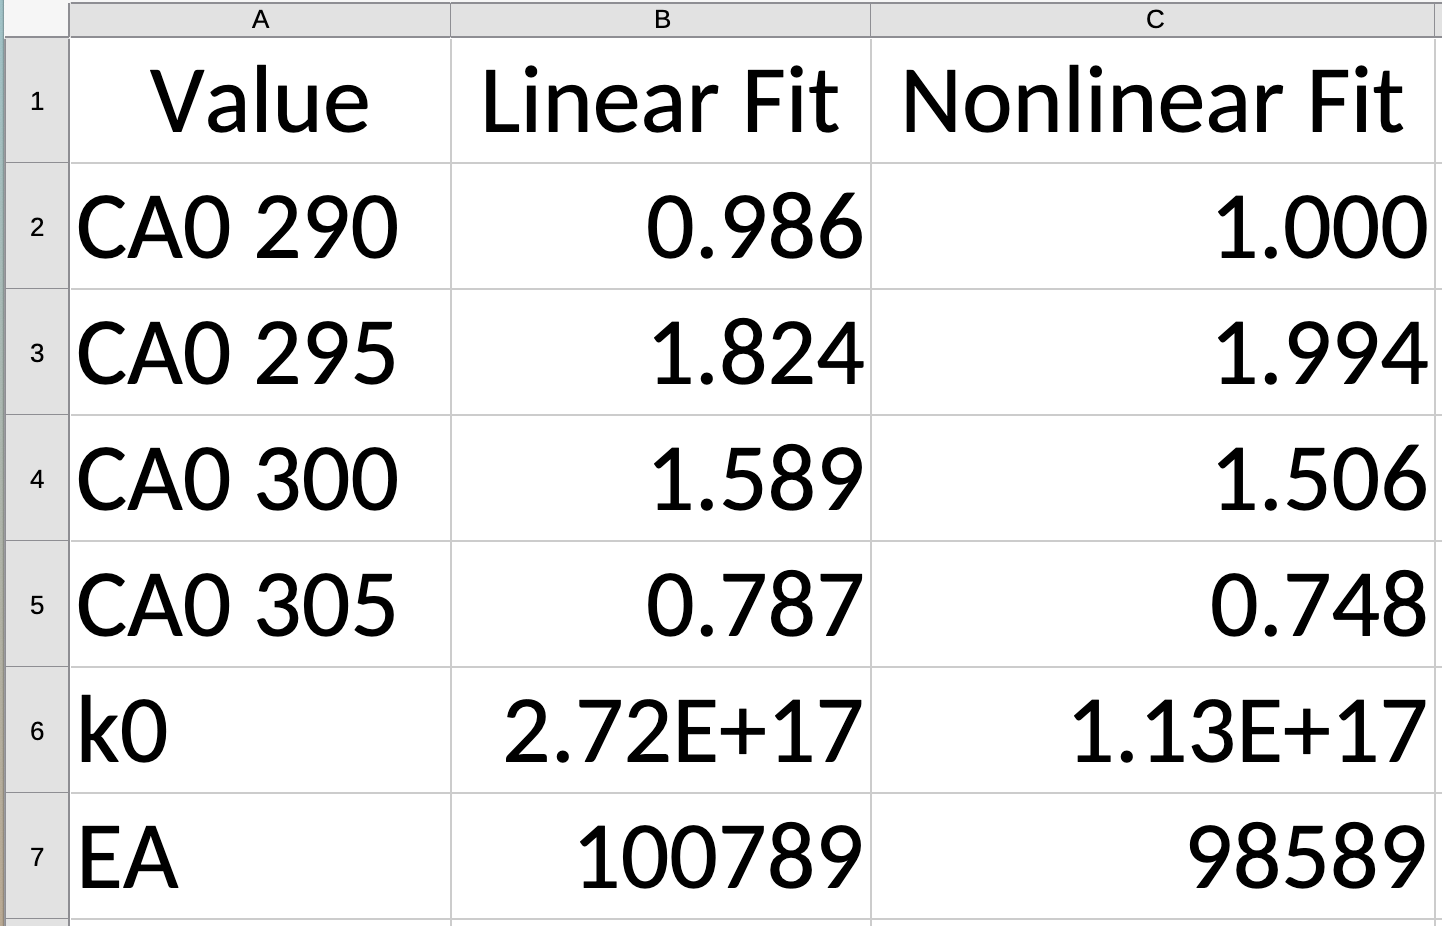
Comparison
Thanks for watching!
The previous in the series video is the link in the upper left. The next video in the series is the link the upper right. To learn more about Chemical and Thermal Processes, visit the website linked in the description.